
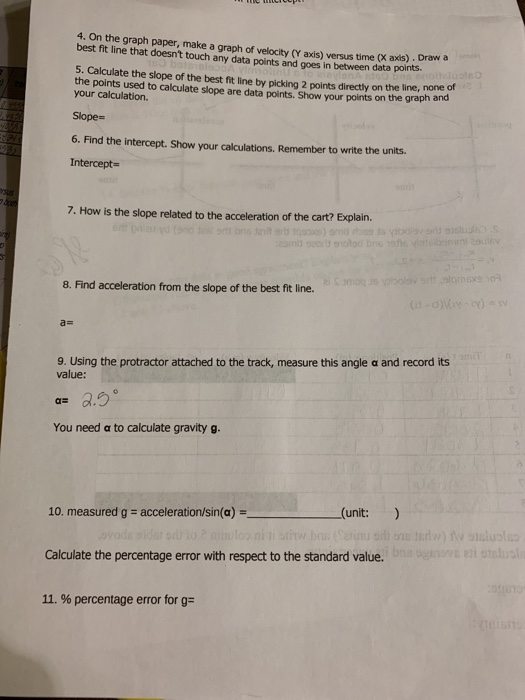
4. On the graph paper, make a graph of velocity (Y axis) versus time (X axts) best fit line that doesnt touch any data points and goes in between . Draw a data points. 5. Calculate the slope of the best fit line by picking 2 points directly on the line, none the points used to calculate slope are data points. Show your points on the graph and your calculation. Slope- 6. Find the intercept. Show your calculations. Remember to write the units Intercept- 7. How is the slope related to the acceleration of the cart? Explain. 8. Find acceleration from the slope of the best fit line. a= 9: Using the protractor attached to the track, measure this angle value: and record its You need a to calculate gravity g. (unit: ) 10. measured g acceleration/sin(a)- Calculate the percentage error with respect to the standard value. 11. % percentage error for g-
12. what is the physical meaning of the intercept? 13. Look at the v/t data in column S of the table. Do you see a trend? If yes, try to explain it. Hint: look at eq. (3) 14. find the % error between your slope and the average calculated at point 3 Er 2xlslope averogel 100 Er slope + average X100... 15. Are the two data in good agreement? Explain your answer and comment on the differences (i.e. try and indicate possible causes for the difference). Hint: refer to points 12 and 13 above.
Homework Answers

Add Answer to:
2. Calculate the velocity at each time (except the first and the last one) by using values immedi...
Velocity v (m/s) v/t (unit= 2 Time t(s) 10.1004 10.3006 0.5008 0.7011 0.9014 1.1017 11.3021 1.5026...
 Velocity v (m/s) v/t (unit= 2 Time t(s) 10.1004 10.3006 0.5008 0.7011 0.9014 1.1017 11.3021 1.5026 Position x (m) 0.149 0.195. 6.271 0.366 0.474 0.599 0.735 0.881 5 0.305 10.427 0.507 10.592 10.651 0 103 1.013624 0.95268 0.722778 0.64 5249 0.591232 0.540218 8 3. calculate w/t (what are the units) and write it in column 5 of the table above Calculate its average and its uncertainty (with units): Average: >0.728 m 1x uncertainty: N e ma max- () mun =...
Loony Wiltz 1.0. Calculations and 1. Sketch the posit Sand Data Analysis of a Uniformly Accelerated...
 Loony Wiltz 1.0. Calculations and 1. Sketch the posit Sand Data Analysis of a Uniformly Accelerated Car Position/time, velocitwtime and acceleration/time graphs acceleration velocity d3= 0.607. 0.5013 0.2017 Hu time Jo=0.808 0.9022 - 0.9ce osing the protractor attached to the track to measure the angle a of inclination on me o and record its value: Vi= 1.101 -0.41 0.36_10.89475601 1.2002.-0.9022" 0.4 0TL V2 = 1.809 -0.912 0.394_ Tou shall need a to calculate gravity per unit mass g. 7 1.5029...
Use the exact values you enter to make later calculations. A group of students performed the...
Use the exact values you enter to make later calculations. A group of students performed the same "Newton's Second Law" experiment that you did in class. For this lab, assume g = 9.81 m/s2. They obtained the following results: m1(kg) t1(s) v1(m/s) t2(s) v2(m/s) 0.050 1.2000 0.2500 1.7279 0.5177 0.100 1.2300 0.3240 1.6064 0.7186 0.150 1.1500 0.3820 1.4591 0.9120 0.200 1.1100 0.4240 1.3806 1.0839 where m1 is the value of the hanging mass (including the mass of the hanger), v1...
Use the exact values you enter to make later calculations. A group of students performed the...
Use the exact values you enter to make later calculations. A group of students performed the same "Newton's Second Law" experiment that you did in class. For this lab, assume g = 9.81 m/s2. They obtained the following results: m1(kg) t1(s) v1(m/s) t2(s) v2(m/s) 0.050 1.2000 0.2500 1.8108 0.3849 0.100 1.2300 0.3240 1.6360 0.6412 0.150 1.1500 0.3820 1.4768 0.8120 0.200 1.1100 0.4240 1.3935 1.0067 where m1 is the value of the hanging mass (including the mass of the hanger), v1...
need help on this graph Physies 195 - Straight-line kinematics Data: Dot period=1/10s: the time interval...
 need help on this graph
Physies 195 - Straight-line kinematics Data: Dot period=1/10s: the time interval between dots is 0.100 corrected values] 15 16 Xc (cm) te(s) 6 7 0 12 3 14. X(cm) t(s) đa (cm) | V (cm/s) 0 0 2.18 0.1002 .182 .0 4.890.200 12.7127.00 2. 5 0.30 3.67 36.70 12.88 o.quo 4.32 430 f 9.95 O S 10 .20 zich were 1 1 tbalo 30,56 38.0 74.50 46.43 0.900 8.8 84.43 55-25 88.00 1101.30 65.39 1.100...
need help on this graph
Physies 195 - Straight-line kinematics Data: Dot period=1/10s: the time interval between dots is 0.100 corrected values] 15 16 Xc (cm) te(s) 6 7 0 12 3 14. X(cm) t(s) đa (cm) | V (cm/s) 0 0 2.18 0.1002 .182 .0 4.890.200 12.7127.00 2. 5 0.30 3.67 36.70 12.88 o.quo 4.32 430 f 9.95 O S 10 .20 zich were 1 1 tbalo 30,56 38.0 74.50 46.43 0.900 8.8 84.43 55-25 88.00 1101.30 65.39 1.100...
Need help with the graph and slope? Data Table 41 Calculation Table 2 L M (g)...
 Need help with the graph and slope?
Data Table 41 Calculation Table 2 L M (g) M (kg) 2 3 4 5 6 7 8 22022 K 2156 N 830M1 3 3 4In 089734 N 122cm 22m 385 5965 K4N 40 309 030 79 040 9 0 3921N D05 K ? I. Using at least 75% of the graph paper, make a graph with ? on Y axis and VT, on the X axis. 2. Draw a best fit line...
Need help with the graph and slope?
Data Table 41 Calculation Table 2 L M (g) M (kg) 2 3 4 5 6 7 8 22022 K 2156 N 830M1 3 3 4In 089734 N 122cm 22m 385 5965 K4N 40 309 030 79 040 9 0 3921N D05 K ? I. Using at least 75% of the graph paper, make a graph with ? on Y axis and VT, on the X axis. 2. Draw a best fit line...
Find equation of line, calculate frequency from constant of proportionality. Plotting graph and data analysis: Pas...
 Find equation of line, calculate frequency from constant of
proportionality.
Plotting graph and data analysis: Pas the厅.vs. λ .5 1.2 7 5 Calculations: Draw the line of the best fit through your data points, and write the equation of the line. Calculate the slope and, referring to Eq. 2, calculate the frequency from the constant of proportionality. (Don't forget to check units) 20.28 -0.28 Slope of the graph- Calculated frequency-120 H Accepted frequency %error Possible source or error:
Find equation of line, calculate frequency from constant of
proportionality.
Plotting graph and data analysis: Pas the厅.vs. λ .5 1.2 7 5 Calculations: Draw the line of the best fit through your data points, and write the equation of the line. Calculate the slope and, referring to Eq. 2, calculate the frequency from the constant of proportionality. (Don't forget to check units) 20.28 -0.28 Slope of the graph- Calculated frequency-120 H Accepted frequency %error Possible source or error:
I try to create a graph but it's doesn't work well one to 4, please thank you so much
 I
try to create a graph but it's doesn't work well one to 4, please
thank you so much
mis) chal 0,400 N 0,050 0.150 0,510.4437 { '나"70 2.u30 N lo.ssak 1.711以1.4as ー 450 N 2.652 m2.52a 9,993 м., 13. 682 0.340 aglysis: Analysis do you 1) Are your calculated accelerations less, greater, or equa think this is? easured observations? Why ng force (y axis) vs. actual acceleration n and Using your data and Microsoft Excel, create a graph of...
I
try to create a graph but it's doesn't work well one to 4, please
thank you so much
mis) chal 0,400 N 0,050 0.150 0,510.4437 { '나"70 2.u30 N lo.ssak 1.711以1.4as ー 450 N 2.652 m2.52a 9,993 м., 13. 682 0.340 aglysis: Analysis do you 1) Are your calculated accelerations less, greater, or equa think this is? easured observations? Why ng force (y axis) vs. actual acceleration n and Using your data and Microsoft Excel, create a graph of...
2 Experiment: In the experiment conducted, the mass of the counter weight M was chosen to...
 2 Experiment: In the experiment conducted, the mass of the counter weight M was chosen to be 50.0 +/- 0.1 g The mass of the rubber stopper was measured to be 12.0 +/- 0.1 g The stopper was spun at five different values of the radius (measured with a meter stick). For each value of r, the time to complete 10 full revolutions was measured with stopwatch. The following data was collected: 40.0 60.0 80.0 100.0 (cm) 1) 120.0 10.74...
from an Atwood's machine experiment using a hanging mass to 2 The table below shows the...
 from an Atwood's machine experiment using a hanging mass to 2 The table below shows the data accrlerane a art The dfierence of the two masses was kept constant, while the total mass was Total mass M Inverse total mass 1/M (kg) 0500 0.600 0700 0 800 1.01 0.83 0.71 0.62 A Complete the third column in the table. (2 Points) B. Plot Acceleration vs. 1/M in increasing order of 1/M, on graph paper.(8 points) C Draw the best-fit straight...
 Velocity v (m/s) v/t (unit= 2 Time t(s) 10.1004 10.3006 0.5008 0.7011 0.9014 1.1017 11.3021 1.5026 Position x (m) 0.149 0.195. 6.271 0.366 0.474 0.599 0.735 0.881 5 0.305 10.427 0.507 10.592 10.651 0 103 1.013624 0.95268 0.722778 0.64 5249 0.591232 0.540218 8 3. calculate w/t (what are the units) and write it in column 5 of the table above Calculate its average and its uncertainty (with units): Average: >0.728 m 1x uncertainty: N e ma max- () mun =...
 Loony Wiltz 1.0. Calculations and 1. Sketch the posit Sand Data Analysis of a Uniformly Accelerated Car Position/time, velocitwtime and acceleration/time graphs acceleration velocity d3= 0.607. 0.5013 0.2017 Hu time Jo=0.808 0.9022 - 0.9ce osing the protractor attached to the track to measure the angle a of inclination on me o and record its value: Vi= 1.101 -0.41 0.36_10.89475601 1.2002.-0.9022" 0.4 0TL V2 = 1.809 -0.912 0.394_ Tou shall need a to calculate gravity per unit mass g. 7 1.5029...
 need help on this graph
Physies 195 - Straight-line kinematics Data: Dot period=1/10s: the time interval between dots is 0.100 corrected values] 15 16 Xc (cm) te(s) 6 7 0 12 3 14. X(cm) t(s) đa (cm) | V (cm/s) 0 0 2.18 0.1002 .182 .0 4.890.200 12.7127.00 2. 5 0.30 3.67 36.70 12.88 o.quo 4.32 430 f 9.95 O S 10 .20 zich were 1 1 tbalo 30,56 38.0 74.50 46.43 0.900 8.8 84.43 55-25 88.00 1101.30 65.39 1.100...
need help on this graph
Physies 195 - Straight-line kinematics Data: Dot period=1/10s: the time interval between dots is 0.100 corrected values] 15 16 Xc (cm) te(s) 6 7 0 12 3 14. X(cm) t(s) đa (cm) | V (cm/s) 0 0 2.18 0.1002 .182 .0 4.890.200 12.7127.00 2. 5 0.30 3.67 36.70 12.88 o.quo 4.32 430 f 9.95 O S 10 .20 zich were 1 1 tbalo 30,56 38.0 74.50 46.43 0.900 8.8 84.43 55-25 88.00 1101.30 65.39 1.100...
 Need help with the graph and slope?
Data Table 41 Calculation Table 2 L M (g) M (kg) 2 3 4 5 6 7 8 22022 K 2156 N 830M1 3 3 4In 089734 N 122cm 22m 385 5965 K4N 40 309 030 79 040 9 0 3921N D05 K ? I. Using at least 75% of the graph paper, make a graph with ? on Y axis and VT, on the X axis. 2. Draw a best fit line...
Need help with the graph and slope?
Data Table 41 Calculation Table 2 L M (g) M (kg) 2 3 4 5 6 7 8 22022 K 2156 N 830M1 3 3 4In 089734 N 122cm 22m 385 5965 K4N 40 309 030 79 040 9 0 3921N D05 K ? I. Using at least 75% of the graph paper, make a graph with ? on Y axis and VT, on the X axis. 2. Draw a best fit line...
 Find equation of line, calculate frequency from constant of
proportionality.
Plotting graph and data analysis: Pas the厅.vs. λ .5 1.2 7 5 Calculations: Draw the line of the best fit through your data points, and write the equation of the line. Calculate the slope and, referring to Eq. 2, calculate the frequency from the constant of proportionality. (Don't forget to check units) 20.28 -0.28 Slope of the graph- Calculated frequency-120 H Accepted frequency %error Possible source or error:
Find equation of line, calculate frequency from constant of
proportionality.
Plotting graph and data analysis: Pas the厅.vs. λ .5 1.2 7 5 Calculations: Draw the line of the best fit through your data points, and write the equation of the line. Calculate the slope and, referring to Eq. 2, calculate the frequency from the constant of proportionality. (Don't forget to check units) 20.28 -0.28 Slope of the graph- Calculated frequency-120 H Accepted frequency %error Possible source or error:
 I
try to create a graph but it's doesn't work well one to 4, please
thank you so much
mis) chal 0,400 N 0,050 0.150 0,510.4437 { '나"70 2.u30 N lo.ssak 1.711以1.4as ー 450 N 2.652 m2.52a 9,993 м., 13. 682 0.340 aglysis: Analysis do you 1) Are your calculated accelerations less, greater, or equa think this is? easured observations? Why ng force (y axis) vs. actual acceleration n and Using your data and Microsoft Excel, create a graph of...
I
try to create a graph but it's doesn't work well one to 4, please
thank you so much
mis) chal 0,400 N 0,050 0.150 0,510.4437 { '나"70 2.u30 N lo.ssak 1.711以1.4as ー 450 N 2.652 m2.52a 9,993 м., 13. 682 0.340 aglysis: Analysis do you 1) Are your calculated accelerations less, greater, or equa think this is? easured observations? Why ng force (y axis) vs. actual acceleration n and Using your data and Microsoft Excel, create a graph of...
 2 Experiment: In the experiment conducted, the mass of the counter weight M was chosen to be 50.0 +/- 0.1 g The mass of the rubber stopper was measured to be 12.0 +/- 0.1 g The stopper was spun at five different values of the radius (measured with a meter stick). For each value of r, the time to complete 10 full revolutions was measured with stopwatch. The following data was collected: 40.0 60.0 80.0 100.0 (cm) 1) 120.0 10.74...
 from an Atwood's machine experiment using a hanging mass to 2 The table below shows the data accrlerane a art The dfierence of the two masses was kept constant, while the total mass was Total mass M Inverse total mass 1/M (kg) 0500 0.600 0700 0 800 1.01 0.83 0.71 0.62 A Complete the third column in the table. (2 Points) B. Plot Acceleration vs. 1/M in increasing order of 1/M, on graph paper.(8 points) C Draw the best-fit straight...
Most questions answered within 3 hours.
-
Estimate the diffusion coefficient for methyl phenyl sulfide in
water at 25 degrees Celcius.
asked 32 minutes ago -
10.g of a certain metal absorb 40. cal of heat and the temperature
is abserved to...
asked 1 hour ago -
The time to complete a standardized exam is approximately normal
with a mean of 70 minutes...
asked 1 hour ago -
Two thousand randomly selected adults were asked whether or not
they have ever shopped on the...
asked 1 hour ago -
How many milliliters of 0.0695 M Ca( OH)
2would be required to exactly neutralize 176 mL...
asked 2 hours ago -
A telephone survey uses a random digit dialing machine to call
subjects. The random digit dialing...
asked 2 hours ago -
How can having too little or too much of a certain
protein cause problems for an...
asked 4 hours ago -
Assume a muscle has a PCSA = 20 cm2 and Lo = 12 cm. Assume it...
asked 5 hours ago -
What is the yield to maturity of a ten-year, $1,000 bond with a
5.2% coupon rate...
asked 6 hours ago -
A mass m = 5 kg is tied on one end of a rope and is...
asked 6 hours ago -
The Average sales price of single-family houses in Charlotte is
$210,000 with a standard deviation of...
asked 6 hours ago -
Target Costing
Laser Impressions, Inc., manufactures color laser printers.
Model J20 presently sells for $225 and...
asked 6 hours ago