
#2 Options
The Prediction Interval would:
-be identical to the confidence interval-
-have the same center as, but would be narrower than the confidence interval-
-be to the left of the confidence interval-
-be to the right of the confidence interval-
-have the same center as, but would be wider than the confidence interval-
#3 Options
The interval computed from a mileage of 31.0 would:
-be narrower but have the same center-
-be wider but have the same center-
-be wider and have a different center-
-the intervals would be identical-
-be narrower and have a different center-
Lower limit: 1, what is the 95% prediction interval for an individual value for used selling price (in thousands of dollars) when the mileage is 31.0 thousand miles? (Carry your intermediate computations to at least four decimal places, and round your answer to at least one decimal place.) Upper limit: 2. Choose one response to answer the question below. Choose one Consider (but do not actually compute) the 95% confidence interalfor the mean used selling price when the mileage is. 310 thousand miles. How would the prediction interval computed above compare to this confidence interval (assuming that both intervals are computed from the same sample data)? 3. Choose one response to answer the question below Choose one For the mileage values in this sample, 34.3 thousand miles is more extreme than 31.0 thousand miles is, that is, 34.3 is farther from the sample mean mileage than 31.0 is. How would the 95% prediction interval for the mean used selling price when the mileage is 31.0 thousand miles compare to the 95% prediction interval for the mean used selling price when the mileage is 34.3 thousand miles? Clear Undo Help Next >> Explain
Homework Answers

Note: Interval of 34.3 is wider than 31.0.
Add Answer to:
#2 Options The Prediction Interval would: -be identical to the confidence interval- -have the sam...
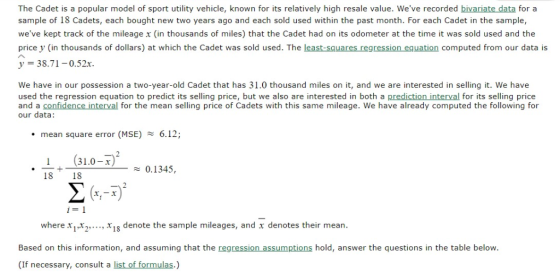
The Cadet is a popular model of sport utility vehicle, known for its relatively high resale value. The bivariate data given below were taken from a sample of sixteen Cadets, each bought new two...
 The Cadet is a popular model of sport utility vehicle, known for its relatively high resale value. The bivariate data given below were taken from a sample of sixteen Cadets, each bought new two years ago, and each sold used within the past month. For each Cadet in the sample, we have listed both the mileage (in thousands of miles) that the Cadet had on its odometer at the time it was sold used and the price y (in thousands...
The Cadet is a popular model of sport utility vehicle, known for its relatively high resale...
 The Cadet is a popular model of sport utility vehicle, known for its relatively high resale value. The bivariate data given below were taken from a sample of fifteen Cadets, each bought new two years ago, and each sold used within the past month. For each Cadet in the sample, we have listed both the mileage (in thousands of miles) that the Cadet had on its odometer at the time it was sold used and the pricey (in thousands of...
With the aim of predicting the selling price of a house in Newburg Park based on...
 With the aim of predicting the selling price of a house in Newburg Park based on the distance the house lies from the beach, we're examining data for houses sold in Newburg Park in the past year. These data detail the distance (x, in miles) of the house from the beach and the selling price (y, in thousands of dollars) of the house for each of 14 houses. The least-squares regression equation based on the data is y=302.76–4.99x. We're interested...
The Cadet is a popular model of sport utility vehicle, known for its relatively high resale...
 The Cadet is a popular model of sport utility vehicle, known for its relatively high resale value. The bivariate data given below were taken from a sample of fifteen Cadets, each bought "new" two years ago and each sold "used" within the past month. For each Cadet in the sample, we have listed both the mileage, X (in thousands of miles), that the Cadet had on its odometer at the time it was sold used, and the price, y (in...
The Cadet is a popular model of sport utility vehicle, known for its relatively high resale...
 The Cadet is a popular model of sport utility vehicle, known for its relatively high resale value. The bivariate data given below were taken from a sample of sixteen Cadets, each bought "new" two years ago and each sold "used" within the past month. For each Cadet in the sample, we have listed both the mileage, x (in thousands of miles), that the Cadet had on its odometer at the time it was sold used, and the price, y (in...
Suppose that you have in your possession bivariate data giving birthrate and life expectancy information for...
 Suppose that you have in your possession bivariate data giving birthrate and life expectancy information for a random sample of 15 countries. For each of the countries, the data give both x, the number of births per one thousand people in the country's population, and y, the country's female life expectancy in years. The least squares regression equation computed from your data is y = 84.06 -0.51x. Suppose that you're predicting the female life expectancy for a country whose birthrate...
Question Help Regression was performed on test data for 49 car models to examine the association...
 Question Help Regression was performed on test data for 49 car models to examine the association between the weight of the car (in thousands of pounds) and the fuel efficiency (in miles per gallon). Complete parts (a) and (b). Click the icon to view the regression table a) Create a 95% confidence interval for the average fuel efficiency among cars weighing 2600 pounds, and explain what your interval means. The 95% confidence interval is (37.92 3930) (Round to two decimal...
A nationwide, standardized test taken by high-school juniors and seniors may or may not measure academic...
 A nationwide, standardized test taken by high-school juniors and seniors may or may not measure academic potential, but we can nonetheless attempt to predict academic performance in college from scores on this test. We have chosen a random sample of 47 students just finishing their first year of college, and for each student we've recorded her score on this standardized test (from 400 to 1600) and her grade point average (on a four point scale) for her first year in...
SUMMARY OUTPUT Confidence Interval Estimate and Prediction Interval Data ression Statistics Confi...
 SUMMARY OUTPUT Confidence Interval Estimate and Prediction Interval Data ression Statistics Confidence Level 95% Multiple R R Square Adjusted R Square Standard Error Observations 0.9035 iven vaue iven value Sa ED1 given value ED2 given value 400 1.7353 ANOVA Predicted Y (YHat) 11.37451 sS Significance F 4.0112E-07 MS For Average Predicted Y (YHat) Regression Residual Total Interval Half Width Confidence Interval Lower Limit Confidence Interval U 1.867459 9.507054 13.24197 60.23 327.84 24 r Limit We were unable to transcribe this...
 The Cadet is a popular model of sport utility vehicle, known for its relatively high resale value. The bivariate data given below were taken from a sample of sixteen Cadets, each bought new two years ago, and each sold used within the past month. For each Cadet in the sample, we have listed both the mileage (in thousands of miles) that the Cadet had on its odometer at the time it was sold used and the price y (in thousands...
 The Cadet is a popular model of sport utility vehicle, known for its relatively high resale value. The bivariate data given below were taken from a sample of fifteen Cadets, each bought new two years ago, and each sold used within the past month. For each Cadet in the sample, we have listed both the mileage (in thousands of miles) that the Cadet had on its odometer at the time it was sold used and the pricey (in thousands of...
 The Cadet is a popular model of sport utility vehicle, known for its relatively high resale value. The bivariate data given below were taken from a sample of fifteen Cadets, each bought new two years ago, and each sold used within the past month. For each Cadet in the sample, we have listed both the mileage (in thousands of miles) that the Cadet had on its odometer at the time it was sold used and the pricey (in thousands of...
 With the aim of predicting the selling price of a house in Newburg Park based on the distance the house lies from the beach, we're examining data for houses sold in Newburg Park in the past year. These data detail the distance (x, in miles) of the house from the beach and the selling price (y, in thousands of dollars) of the house for each of 14 houses. The least-squares regression equation based on the data is y=302.76–4.99x. We're interested...
 The Cadet is a popular model of sport utility vehicle, known for its relatively high resale value. The bivariate data given below were taken from a sample of fifteen Cadets, each bought "new" two years ago and each sold "used" within the past month. For each Cadet in the sample, we have listed both the mileage, X (in thousands of miles), that the Cadet had on its odometer at the time it was sold used, and the price, y (in...
 The Cadet is a popular model of sport utility vehicle, known for its relatively high resale value. The bivariate data given below were taken from a sample of sixteen Cadets, each bought "new" two years ago and each sold "used" within the past month. For each Cadet in the sample, we have listed both the mileage, x (in thousands of miles), that the Cadet had on its odometer at the time it was sold used, and the price, y (in...
 Suppose that you have in your possession bivariate data giving birthrate and life expectancy information for a random sample of 15 countries. For each of the countries, the data give both x, the number of births per one thousand people in the country's population, and y, the country's female life expectancy in years. The least squares regression equation computed from your data is y = 84.06 -0.51x. Suppose that you're predicting the female life expectancy for a country whose birthrate...
 Question Help Regression was performed on test data for 49 car models to examine the association between the weight of the car (in thousands of pounds) and the fuel efficiency (in miles per gallon). Complete parts (a) and (b). Click the icon to view the regression table a) Create a 95% confidence interval for the average fuel efficiency among cars weighing 2600 pounds, and explain what your interval means. The 95% confidence interval is (37.92 3930) (Round to two decimal...
 A nationwide, standardized test taken by high-school juniors and seniors may or may not measure academic potential, but we can nonetheless attempt to predict academic performance in college from scores on this test. We have chosen a random sample of 47 students just finishing their first year of college, and for each student we've recorded her score on this standardized test (from 400 to 1600) and her grade point average (on a four point scale) for her first year in...
 SUMMARY OUTPUT Confidence Interval Estimate and Prediction Interval Data ression Statistics Confidence Level 95% Multiple R R Square Adjusted R Square Standard Error Observations 0.9035 iven vaue iven value Sa ED1 given value ED2 given value 400 1.7353 ANOVA Predicted Y (YHat) 11.37451 sS Significance F 4.0112E-07 MS For Average Predicted Y (YHat) Regression Residual Total Interval Half Width Confidence Interval Lower Limit Confidence Interval U 1.867459 9.507054 13.24197 60.23 327.84 24 r Limit We were unable to transcribe this...
Most questions answered within 3 hours.
-
You have been asked to develop a new line of organic skincare
products. Spend time with...
asked 6 minutes ago -
Summerdahl Resort's common stock is currently trading at $37 a
share. The stock is expected to...
asked 26 minutes ago -
To an economist, the field of industrial organization answers
which of the following questions?
asked 30 minutes ago -
How could meeting industry expectations, propel managers into
challenging and possible conflict of interest situations? How...
asked 54 minutes ago -
You have been married to your spouse for 10 years. You have two
small children (ages...
asked 2 hours ago -
Spiderman makes a leap from one building to
another. He starts on one building that is...
asked 2 hours ago -
A
symbol is something that stands for something else. What are the
symbols in education?what are...
asked 3 hours ago -
The charge to the left in the figure above has a
magnitude of 2.90 nC, and...
asked 4 hours ago -
Verify the MIRR is 9.29% given cash flows in years 1 and 2 of
$1,000 each,...
asked 5 hours ago -
Calculate the pH of a 5.7 M solution of aniline (C6H5NH2; Kb =
3.8 x 10^-10)
asked 7 hours ago -
LSL R3, R3, R12
Memory
Address
Orig.
Data
Updated
Data
Register
Orig.
Data
Updated
Data
0x84F0...
asked 7 hours ago -
Air at 100 kPa and density of 1.2 kg/m3 flows upward through a
5-cm diameter inclined...
asked 7 hours ago