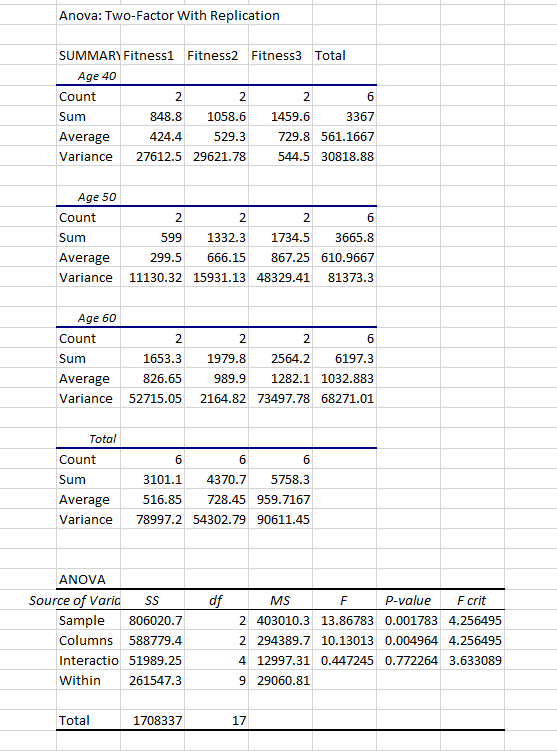
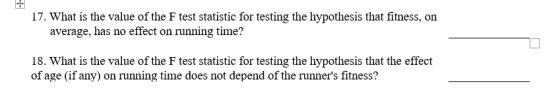
17. What is the value of the F test statistic for testing the hypothesis that fitness, on average, has no effect on running time? 18. What is the value of the F test statistic for testing the hypothesis that the effect of age (if any) on running time does not depend of the runner's fitness?
Homework Answers

Add Answer to:
Anova: Two-Factor With Replication SUMMARY Fitness1 Fitness2 Fitness3 Total Age 40 Count Sum Aver...
Question Completion Status QUESTION 4 Anova: Single Factor SUMMARY Groups Count Sum Average Variance A 4...
 Question Completion Status QUESTION 4 Anova: Single Factor SUMMARY Groups Count Sum Average Variance A 4 108 27 32.66666667 B 4 96 24 13.33333333 4 120 30 56 ANOVA Source of Variation SS df F crit MS P-value F Treatments 72 36 1.058823529 0.386396621 4.256494729 Error 306 9 34 Total 378 11 Based on the Results above of Single Factor ANOVA: the MSTR O 36 O 378 O 72 O 34 Click Save and Submit to save and submit. Chick...
Anova: Single Factor SUMMARY Groups Count CAR1 CAR2 CAR3 CAR4 SumAverage Variance 178.9 19.87778 ...
 T test statistic
Anova: Single Factor SUMMARY Groups Count CAR1 CAR2 CAR3 CAR4 SumAverage Variance 178.9 19.87778 9.309444 11119.4 10.85455 10.15873 11241.1 21.91818 13.06164 14.49 7.894333 9 10 144.9 ANOVA Source of Varid Ss MS P-value F crit Between ( 815.10793 271.7026 26.61437 2.39E-09 2.8587916 Within Gr 377.7282 37 10.20887 Total 1192.836 40 Conduct a test of hypothesis that the mean mileage of makes 2 and 3 do not differ. Use the method for single means when σ is not...
T test statistic
Anova: Single Factor SUMMARY Groups Count CAR1 CAR2 CAR3 CAR4 SumAverage Variance 178.9 19.87778 9.309444 11119.4 10.85455 10.15873 11241.1 21.91818 13.06164 14.49 7.894333 9 10 144.9 ANOVA Source of Varid Ss MS P-value F crit Between ( 815.10793 271.7026 26.61437 2.39E-09 2.8587916 Within Gr 377.7282 37 10.20887 Total 1192.836 40 Conduct a test of hypothesis that the mean mileage of makes 2 and 3 do not differ. Use the method for single means when σ is not...
End Of Game Anova: Two-Factor Without Replication SUMMARY Count Sum Average Variance 1 5 11322.6 ...
 End Of Game Anova: Two-Factor Without Replication SUMMARY Count Sum Average Variance 1 5 11322.6 22.3 | 23 | 10.51 5 115 3 5 12224.412.8 5 127254 21.8 25.4 132 26.4 32.3 64.3 5 128 5110 25.6 Mon Tue Wed Thurs Fri 7 175 7 168 25 40 24 17 7 14721 3.333333 22 6.666667 7203 29 13.33333 71 154 ANOVA Source of Variation MSF P-value F crit 0.863774 0.535234 2.508189 Rows Columns Error 85.6 271.6 67.9 24 Total 753.634...
40 1 363.9 40 1 501.4 40 2 448.2 40 2 914 40 3 532.2 40...
40 1 363.9 40 1 501.4 40 2 448.2 40 2 914 40 3 532.2 40 3 589.8 50 1 810.2 50 1 688.3 50 2 385.4 50 2 790.7 50 3 800.7 50 3 796.2 60 1 376.8 60 1 982 60 2 1049 60 2 589.2 60 3 547.3 60 3 619.3 Age 40 50 60 Fitness 1 363.9 810.2 376.8 501.4 688.3 982 Fitness 2 448.2 385.4 1049 914 790.7 589.2 Fitness 3 532.2 800.7 547.3 589.8...
The results of a two-factor ANOVA without replication are displayed below with missing values, identified by " A" through " G." What values should replace "A", "B", and...
 The results of a two-factor ANOVA without replication are
displayed below with missing values, identified by " A" through "
G." What values should replace "A", "B", and "C"? Explain
your responses.
East 87.3 84.3 74.5 South 73.2 69.4 72.3 Midwest 82.3 83.2 73.4 West 76.0 75.2 68.4 Low Medium High ANOVA: Two-Factor Without Replication SUMMARY Count 4 4 4 Sum Average Variance 40.15333 78.025 49.50917 7.056667 79.7 Low Medium High 72.15 East South Midwest West 82.03333 44.81333 71.63333 3.943333...
The results of a two-factor ANOVA without replication are
displayed below with missing values, identified by " A" through "
G." What values should replace "A", "B", and "C"? Explain
your responses.
East 87.3 84.3 74.5 South 73.2 69.4 72.3 Midwest 82.3 83.2 73.4 West 76.0 75.2 68.4 Low Medium High ANOVA: Two-Factor Without Replication SUMMARY Count 4 4 4 Sum Average Variance 40.15333 78.025 49.50917 7.056667 79.7 Low Medium High 72.15 East South Midwest West 82.03333 44.81333 71.63333 3.943333...
Anova: Single Factor SUMMARY Count Av Variance Sum 165.000000000 27.500000000 8.300000000 174.000000000 29.000000000 2.000000000 155.000000000 25.833333333...
 Anova: Single Factor SUMMARY Count Av Variance Sum 165.000000000 27.500000000 8.300000000 174.000000000 29.000000000 2.000000000 155.000000000 25.833333333 1.366666667 188.000000000 31.333333333 0.666666667 ANOVA P.value Fcrit Between Groups 98.166666667 3 Within Groups 61.666666667 20 MS 32.722222222 10.612612613 0.000217836 3.098391196 3.083333333 Total 159.833333333 23 TUKEY MULTIPLE COMPARISON TEST Distance 2.838767338 3.96 0.05 Means joined by a double line are not significantly different. 25.833333969 27.500000000 29.000000000 31.333333969 19. Is there a statistically significant difference in the average processing time between the four products? A. Yes,...
What is the ANOVA F test statistic value? A researcher wishes to see if there is...
 What is the ANOVA F test statistic value?
A researcher wishes to see if there is a difference in the number of stories in the tall buildings of Chicago, Houston, and New York City. The researcher randomly selects six buildings in each city and records the number of stories in each building. At a = 0.05, can it be concluded that there is a significant difference in the mean number of stories in the tall buildings in each city? Use...
What is the ANOVA F test statistic value?
A researcher wishes to see if there is a difference in the number of stories in the tall buildings of Chicago, Houston, and New York City. The researcher randomly selects six buildings in each city and records the number of stories in each building. At a = 0.05, can it be concluded that there is a significant difference in the mean number of stories in the tall buildings in each city? Use...
A sociologist classified 45 faculty members by subject matter of course (factor A with 4 levels) and highest degree earned (factor B with 3 levels) The first ANOVA table below is from a model includi...
 A sociologist classified 45 faculty members by subject matter of course (factor A with 4 levels) and highest degree earned (factor B with 3 levels) The first ANOVA table below is from a model including A and B main effects and AB interaction effects. The second one is from a model including B main effects and AB interaction effects but no A main effects Sequential sum of squares ANOVA table with A, B and AB terms. Analysis of Variance Source...
ANOVA Source of Variation SS df MS F p-value Factor A 35,166.79 3 11,722.26 Factor...
ANOVA Source of Variation SS df MS F p-value Factor A 35,166.79 3 11,722.26 Factor B 22,297.66 2 11,148.83 Interaction 206,903.76 6 34,483.96 Error 125,290.42 36 3,480.29 Total 389,658.63 47 (a) What kind of ANOVA is this? One-factor ANOVA Two-factor ANOVA with replication Two-factor ANOVA without replication (b) Calculate each F test statistic and the p-value for each F test using Excel's function =F.DIST.RT(F,DF1,DF2). (Round your Fcalc values to 3 decimal places and p-values to...
ANOVA Source of Variation SS df MS F p-value Factor A 30,865.45 3 10,288.48 Factor B...
ANOVA Source of Variation SS df MS F p-value Factor A 30,865.45 3 10,288.48 Factor B 22,557.30 2 11,278.65 Interaction 119,155.58 6 19,859.26 Error 90,553.57 36 2,515.38 Total 263,131.90 47 (a) What kind of ANOVA is this? One-factor ANOVA Two-factor ANOVA with replication Two-factor ANOVA without replication (b) Calculate each F test statistic and the p-value for each F test using Excel's function =F.DIST.RT(F,DF1,DF2). (Round your Fcalcvalues to 3 decimal places and p-values to 4 decimal places.) Source of Variation...
 Question Completion Status QUESTION 4 Anova: Single Factor SUMMARY Groups Count Sum Average Variance A 4 108 27 32.66666667 B 4 96 24 13.33333333 4 120 30 56 ANOVA Source of Variation SS df F crit MS P-value F Treatments 72 36 1.058823529 0.386396621 4.256494729 Error 306 9 34 Total 378 11 Based on the Results above of Single Factor ANOVA: the MSTR O 36 O 378 O 72 O 34 Click Save and Submit to save and submit. Chick...
 T test statistic
Anova: Single Factor SUMMARY Groups Count CAR1 CAR2 CAR3 CAR4 SumAverage Variance 178.9 19.87778 9.309444 11119.4 10.85455 10.15873 11241.1 21.91818 13.06164 14.49 7.894333 9 10 144.9 ANOVA Source of Varid Ss MS P-value F crit Between ( 815.10793 271.7026 26.61437 2.39E-09 2.8587916 Within Gr 377.7282 37 10.20887 Total 1192.836 40 Conduct a test of hypothesis that the mean mileage of makes 2 and 3 do not differ. Use the method for single means when σ is not...
T test statistic
Anova: Single Factor SUMMARY Groups Count CAR1 CAR2 CAR3 CAR4 SumAverage Variance 178.9 19.87778 9.309444 11119.4 10.85455 10.15873 11241.1 21.91818 13.06164 14.49 7.894333 9 10 144.9 ANOVA Source of Varid Ss MS P-value F crit Between ( 815.10793 271.7026 26.61437 2.39E-09 2.8587916 Within Gr 377.7282 37 10.20887 Total 1192.836 40 Conduct a test of hypothesis that the mean mileage of makes 2 and 3 do not differ. Use the method for single means when σ is not...
 End Of Game Anova: Two-Factor Without Replication SUMMARY Count Sum Average Variance 1 5 11322.6 22.3 | 23 | 10.51 5 115 3 5 12224.412.8 5 127254 21.8 25.4 132 26.4 32.3 64.3 5 128 5110 25.6 Mon Tue Wed Thurs Fri 7 175 7 168 25 40 24 17 7 14721 3.333333 22 6.666667 7203 29 13.33333 71 154 ANOVA Source of Variation MSF P-value F crit 0.863774 0.535234 2.508189 Rows Columns Error 85.6 271.6 67.9 24 Total 753.634...
 The results of a two-factor ANOVA without replication are
displayed below with missing values, identified by " A" through "
G." What values should replace "A", "B", and "C"? Explain
your responses.
East 87.3 84.3 74.5 South 73.2 69.4 72.3 Midwest 82.3 83.2 73.4 West 76.0 75.2 68.4 Low Medium High ANOVA: Two-Factor Without Replication SUMMARY Count 4 4 4 Sum Average Variance 40.15333 78.025 49.50917 7.056667 79.7 Low Medium High 72.15 East South Midwest West 82.03333 44.81333 71.63333 3.943333...
The results of a two-factor ANOVA without replication are
displayed below with missing values, identified by " A" through "
G." What values should replace "A", "B", and "C"? Explain
your responses.
East 87.3 84.3 74.5 South 73.2 69.4 72.3 Midwest 82.3 83.2 73.4 West 76.0 75.2 68.4 Low Medium High ANOVA: Two-Factor Without Replication SUMMARY Count 4 4 4 Sum Average Variance 40.15333 78.025 49.50917 7.056667 79.7 Low Medium High 72.15 East South Midwest West 82.03333 44.81333 71.63333 3.943333...
 Anova: Single Factor SUMMARY Count Av Variance Sum 165.000000000 27.500000000 8.300000000 174.000000000 29.000000000 2.000000000 155.000000000 25.833333333 1.366666667 188.000000000 31.333333333 0.666666667 ANOVA P.value Fcrit Between Groups 98.166666667 3 Within Groups 61.666666667 20 MS 32.722222222 10.612612613 0.000217836 3.098391196 3.083333333 Total 159.833333333 23 TUKEY MULTIPLE COMPARISON TEST Distance 2.838767338 3.96 0.05 Means joined by a double line are not significantly different. 25.833333969 27.500000000 29.000000000 31.333333969 19. Is there a statistically significant difference in the average processing time between the four products? A. Yes,...
 What is the ANOVA F test statistic value?
A researcher wishes to see if there is a difference in the number of stories in the tall buildings of Chicago, Houston, and New York City. The researcher randomly selects six buildings in each city and records the number of stories in each building. At a = 0.05, can it be concluded that there is a significant difference in the mean number of stories in the tall buildings in each city? Use...
What is the ANOVA F test statistic value?
A researcher wishes to see if there is a difference in the number of stories in the tall buildings of Chicago, Houston, and New York City. The researcher randomly selects six buildings in each city and records the number of stories in each building. At a = 0.05, can it be concluded that there is a significant difference in the mean number of stories in the tall buildings in each city? Use...
 A sociologist classified 45 faculty members by subject matter of course (factor A with 4 levels) and highest degree earned (factor B with 3 levels) The first ANOVA table below is from a model including A and B main effects and AB interaction effects. The second one is from a model including B main effects and AB interaction effects but no A main effects Sequential sum of squares ANOVA table with A, B and AB terms. Analysis of Variance Source...
Most questions answered within 3 hours.
-
Bank of America has bonds that pay a coupon interest rate of 5.5
percent and mature...
asked 33 minutes ago -
Problem: Patient Fees C++
You are to write a program that computes a patient’s bill for...
asked 2 hours ago -
In a population of interest, we know that, 77% drink coffee, and
23% drink tea. Assume...
asked 2 hours ago -
Given that f(x) = e-(x-1) for x > 1, determine the following
probabilities:
a) P(X <...
asked 2 hours ago -
A mechanic pushes a 2.60 ✕ 103-kg car from rest to a speed of v,
doing...
asked 2 hours ago -
International information systems result in all of the following
except:
A. improved quality of information flow....
asked 2 hours ago -
The president of the retailer Prime Products has just approached
the company’s bank with a request...
asked 2 hours ago -
If the carrying amount is $200,000 and recoverable amount is
$205000, the impairment amount is:
Select...
asked 2 hours ago -
The correlation is inappropriate as a measure of association
between two quantitative variables (you may select...
asked 2 hours ago -
USE THE DATA IN THE TABLE BELOW TO ANSWER QUESTIONS 19 – 24
(Assume all account...
asked 2 hours ago -
Mahaley, Inc., manufactures and sells two products: Product Q9
and Product F0. Data concerning the expected...
asked 2 hours ago -
To measure the current through one branch of a parallel circuit,
the meter is connected ________....
asked 2 hours ago