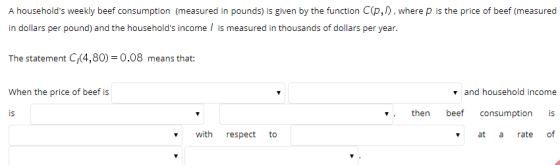
When the price of beef is ( 4, 80, 0.8, dollars per pound, pounds, thousand dollars per year, pounds per dollar per pound, pounds per thousand dollars per year, increasing, decreasing, beef price, household income ) ( 4, 80, 0.8, dollars per pound, pounds, thousand dollars per year, pounds per dollar per pound, pounds per thousand dollars per year, increasing, decreasing, beef price, household income ) and household income is ( 4, 80, 0.8, dollars per pound, pounds, thousand dollars per year, pounds per dollar per pound, pounds per thousand dollars per year, increasing, decreasing, beef price, household income ) ( 4, 80, 0.8, dollars per pound, pounds, thousand dollars per year, pounds per dollar per pound, pounds per thousand dollars per year, increasing, decreasing, beef price, household income ), then beef consumption is ( 4, 80, 0.8, dollars per pound, pounds, thousand dollars per year, pounds per dollar per pound, pounds per thousand dollars per year, increasing, decreasing, beef price, household income ) with respect to ( 4, 80, 0.8, dollars per pound, pounds, thousand dollars per year, pounds per dollar per pound, pounds per thousand dollars per year, increasing, decreasing, beef price, household income ) at a rate of ( 4, 80, 0.8, dollars per pound, pounds, thousand dollars per year, pounds per dollar per pound, pounds per thousand dollars per year, increasing, decreasing, beef price, household income ) ( 4, 80, 0.8, dollars per pound, pounds, thousand dollars per year, pounds per dollar per pound, pounds per thousand dollars per year, increasing, decreasing, beef price, household income ).
Homework Answers
Add Answer to:
When the price of beef is ( 4, 80, 0.8, dollars per pound, pounds, thousand dollars per year, pou...
Jack Hardware sold 8 pounds of bolts yesterday at a price of $5,.00 per pound.
 Jack Hardware sold 8 pounds of bolts yesterday at a price of $5,.00 per pound. This point is represented by the black plus symbol on the diagram below, which plots the price of bolts (measured in dollars, per pound) and the quantity sold (measured in pounds).Each small square in the grid for this graph has one side equal to 1 pound of bolts and one side equal to 1 dollar per pound. The area of one small square is therefore...
4. Question 4: Consider the following equation for U.S. per capita consumption of beef: CB--330.3+ 49.1InY,...
 4. Question 4: Consider the following equation for U.S. per capita consumption of beef: CB--330.3+ 49.1InY, 0.34 PB,+0.33 PRP 15.4 D (se 7.4 t-6.6) (se-0.13 -2.6) (se-0.12 t-2.7) (se-4.1 -3.7) RP = 0.7 N 28 DW = 0.94 where CB. the annual per capita pounds of beef consumed in the U.S. in year t, In Yǐ : the log of per capita disposable real income in the U.S. in year t, PBt Ξ , PRI average annualized real wholesale price...
solution please Q(5): Price Quantity Quantity (dollars per supplied demanded pound) (pounds) (pounds) 3 1 7...
 solution please
Q(5): Price Quantity Quantity (dollars per supplied demanded pound) (pounds) (pounds) 3 1 7 4 2 5 5 4 4 6 5 2 7 6 1 The above table shows the demand schedule and supply schedule for chocolate chip cookies. Use the Demand function and Supply function to find the equilibrium quantity and equilibrium price for chocolate chip cookies? Equilibrium quantity= 4 Equilibrium Price= 5 Q(6): Personal computers are becoming less expensive as new technology reduces the cost...
solution please
Q(5): Price Quantity Quantity (dollars per supplied demanded pound) (pounds) (pounds) 3 1 7 4 2 5 5 4 4 6 5 2 7 6 1 The above table shows the demand schedule and supply schedule for chocolate chip cookies. Use the Demand function and Supply function to find the equilibrium quantity and equilibrium price for chocolate chip cookies? Equilibrium quantity= 4 Equilibrium Price= 5 Q(6): Personal computers are becoming less expensive as new technology reduces the cost...
Regression model>BEEF_CONSt - Bl B2INCOMEt+B3BEEF PRICEt B4PORK PRICEt+ et BEEF CONSIconsumption of beef per cap...
 Regression model>BEEF_CONSt - Bl B2INCOMEt+B3BEEF PRICEt B4PORK PRICEt+ et BEEF CONSIconsumption of beef per capita in year t (kg), INCOMEt real income per capita in year t (thousands of dollars), BEEF PRICEt average real price of beef per kilogram in year t ($) PORK PRICEt= average real price of pork per kilogram in year t (S) Bk's regression cocfficients, and et is the random error term, which follows N(0, o2) Gretl Output for Section 2 Sunmary Stati stics Mean Median...
Rate of change Question 2 A product is being sold currently for $25 with the price increasing at the rate of $2 per year. At this price, customers buy 150 thousand items but the quantity being bought...
 Rate of change
Question 2 A product is being sold currently for $25 with the price increasing at the rate of $2 per year. At this price, customers buy 150 thousand items but the quantity being bought is decreasing at the rate of 8 thousand per year Remember Revenue R(t) Quantity Q(e) x Price P(t) and show units. (a) If Q(0) is 150 (thousand) items, what is q'(0)? (b) What is P(O) (c) Hence find the rate at which the...
Rate of change
Question 2 A product is being sold currently for $25 with the price increasing at the rate of $2 per year. At this price, customers buy 150 thousand items but the quantity being bought is decreasing at the rate of 8 thousand per year Remember Revenue R(t) Quantity Q(e) x Price P(t) and show units. (a) If Q(0) is 150 (thousand) items, what is q'(0)? (b) What is P(O) (c) Hence find the rate at which the...
Price (dollars per pound) 13- Sus 12- 11- The graph shows the market for lobster in...
 Price (dollars per pound) 13- Sus 12- 11- The graph shows the market for lobster in the United States. The world price of lobster is $6 a pound. Suppose the U.S. government imposes a tariff of $1 a pound on lobster imported into the United States. Draw a line to show the price of lobster in the United States. Label it U.S. price. Draw a point to show the quantity of lobster supplied by U.S. producers and the price at...
30 Price or eating Oil (Dollars per barrel) Quantity Demanded (Thousands of barrels per day) 100...
 30 Price or eating Oil (Dollars per barrel) Quantity Demanded (Thousands of barrels per day) 100 60 Quantity Supplied (Thousands of barrels per day) PRICE (Dollars per barrel) Demand Shifters Supply Shifters Gas Cost of Crude Oil (Per barrel of heating on Price of Natural (Dollars per 1,000 cubicit) Price of an Oil Furnace (Dollars per furnace) Average Annual Income (Thousands of dollars) 2000 Cost of Refining of (Per barrel of heating oil) 20 40 60 80 100 120 140...
Part 1: Short Answer Questions (10 points each) 1) The estimated Canadian processed pork demand and...
 Part 1: Short Answer Questions (10 points each) 1) The estimated Canadian processed pork demand and supply functions are as the follow- ings: Qp = 100-3 p + 3 p + 5 + 2 Y, Os = 100 + 6 - 8 PA where Q is the quantity in million kilograms (kg) of pork per year; p is the dollar price per kg, Po is the price of beef per kg, pe is the price of chicken per kg, P,...
1) The estimated Canadian processed pork demand and supply functions are as the follow- ings: 100-3p+3...
 1) The estimated Canadian processed pork demand and supply functions are as the follow- ings: 100-3p+3 p 5 p+2 Y Qs=100+6p- 8 Ph where Q is the quantity in million kilograms (kg) of pork per year; p is the dollar price per kg, Pb is the price of beef per kg, Pe is the price of chicken per kg, Ph is the price of hogs per kg, and Y is the average income in thousand dollars. Suppose that p, $8.00...
4. The price and average per capita consumption per year of a food-bundle and transportation of...
 4. The price and average per capita consumption per year of a food-bundle and transportation of the same quality in Russia and US are Food-bundle P Q Transportation RESP Russia 40,000 rubles 1 300,000 rubles 1/15 The US $10,000 $10,000 a) Compute Russia and US per capita consumption in rubles and dollars, respectively. b) Assuming $1-30 rubles exchange rate, convert Russia's per capita consumption from rubles to dollars. c) Using PPP, i.e., the same prices in the two countries, and...
 4. Question 4: Consider the following equation for U.S. per capita consumption of beef: CB--330.3+ 49.1InY, 0.34 PB,+0.33 PRP 15.4 D (se 7.4 t-6.6) (se-0.13 -2.6) (se-0.12 t-2.7) (se-4.1 -3.7) RP = 0.7 N 28 DW = 0.94 where CB. the annual per capita pounds of beef consumed in the U.S. in year t, In Yǐ : the log of per capita disposable real income in the U.S. in year t, PBt Ξ , PRI average annualized real wholesale price...
 solution please
Q(5): Price Quantity Quantity (dollars per supplied demanded pound) (pounds) (pounds) 3 1 7 4 2 5 5 4 4 6 5 2 7 6 1 The above table shows the demand schedule and supply schedule for chocolate chip cookies. Use the Demand function and Supply function to find the equilibrium quantity and equilibrium price for chocolate chip cookies? Equilibrium quantity= 4 Equilibrium Price= 5 Q(6): Personal computers are becoming less expensive as new technology reduces the cost...
solution please
Q(5): Price Quantity Quantity (dollars per supplied demanded pound) (pounds) (pounds) 3 1 7 4 2 5 5 4 4 6 5 2 7 6 1 The above table shows the demand schedule and supply schedule for chocolate chip cookies. Use the Demand function and Supply function to find the equilibrium quantity and equilibrium price for chocolate chip cookies? Equilibrium quantity= 4 Equilibrium Price= 5 Q(6): Personal computers are becoming less expensive as new technology reduces the cost...
 Regression model>BEEF_CONSt - Bl B2INCOMEt+B3BEEF PRICEt B4PORK PRICEt+ et BEEF CONSIconsumption of beef per capita in year t (kg), INCOMEt real income per capita in year t (thousands of dollars), BEEF PRICEt average real price of beef per kilogram in year t ($) PORK PRICEt= average real price of pork per kilogram in year t (S) Bk's regression cocfficients, and et is the random error term, which follows N(0, o2) Gretl Output for Section 2 Sunmary Stati stics Mean Median...
 Rate of change
Question 2 A product is being sold currently for $25 with the price increasing at the rate of $2 per year. At this price, customers buy 150 thousand items but the quantity being bought is decreasing at the rate of 8 thousand per year Remember Revenue R(t) Quantity Q(e) x Price P(t) and show units. (a) If Q(0) is 150 (thousand) items, what is q'(0)? (b) What is P(O) (c) Hence find the rate at which the...
Rate of change
Question 2 A product is being sold currently for $25 with the price increasing at the rate of $2 per year. At this price, customers buy 150 thousand items but the quantity being bought is decreasing at the rate of 8 thousand per year Remember Revenue R(t) Quantity Q(e) x Price P(t) and show units. (a) If Q(0) is 150 (thousand) items, what is q'(0)? (b) What is P(O) (c) Hence find the rate at which the...
 Price (dollars per pound) 13- Sus 12- 11- The graph shows the market for lobster in the United States. The world price of lobster is $6 a pound. Suppose the U.S. government imposes a tariff of $1 a pound on lobster imported into the United States. Draw a line to show the price of lobster in the United States. Label it U.S. price. Draw a point to show the quantity of lobster supplied by U.S. producers and the price at...
 30 Price or eating Oil (Dollars per barrel) Quantity Demanded (Thousands of barrels per day) 100 60 Quantity Supplied (Thousands of barrels per day) PRICE (Dollars per barrel) Demand Shifters Supply Shifters Gas Cost of Crude Oil (Per barrel of heating on Price of Natural (Dollars per 1,000 cubicit) Price of an Oil Furnace (Dollars per furnace) Average Annual Income (Thousands of dollars) 2000 Cost of Refining of (Per barrel of heating oil) 20 40 60 80 100 120 140...
 Part 1: Short Answer Questions (10 points each) 1) The estimated Canadian processed pork demand and supply functions are as the follow- ings: Qp = 100-3 p + 3 p + 5 + 2 Y, Os = 100 + 6 - 8 PA where Q is the quantity in million kilograms (kg) of pork per year; p is the dollar price per kg, Po is the price of beef per kg, pe is the price of chicken per kg, P,...
 1) The estimated Canadian processed pork demand and supply functions are as the follow- ings: 100-3p+3 p 5 p+2 Y Qs=100+6p- 8 Ph where Q is the quantity in million kilograms (kg) of pork per year; p is the dollar price per kg, Pb is the price of beef per kg, Pe is the price of chicken per kg, Ph is the price of hogs per kg, and Y is the average income in thousand dollars. Suppose that p, $8.00...
 4. The price and average per capita consumption per year of a food-bundle and transportation of the same quality in Russia and US are Food-bundle P Q Transportation RESP Russia 40,000 rubles 1 300,000 rubles 1/15 The US $10,000 $10,000 a) Compute Russia and US per capita consumption in rubles and dollars, respectively. b) Assuming $1-30 rubles exchange rate, convert Russia's per capita consumption from rubles to dollars. c) Using PPP, i.e., the same prices in the two countries, and...
Most questions answered within 3 hours.
-
You are attempting to calculate a firm’s free cash flow to
equity. You know the following...
asked 29 minutes ago -
the following reaction occurs in a balloon containing
N2O2 gas
N2O4(g)=2NO2(g)
will the volume of the...
asked 1 hour ago -
answer the questions throughout this program
public class Day implements Comparable {
Private Boolean atWork;...
asked 1 hour ago -
This is C++ code for parking fee management program
#include <iostream>
#include <iomanip>
using namespace std;...
asked 1 hour ago -
The free energy change for the following reaction at 25 °C, when
[Sn2+] = 1.17 M...
asked 3 hours ago -
An MNE is this kind of industry when competition in one country
is essentially independent of...
asked 4 hours ago -
. For this set of questions, determine what
proportion of a normal distribution is located betweeneach...
asked 5 hours ago -
A college student is employed as a door-to-door newspaper
salesman. Historical data suggests that the student...
asked 6 hours ago -
MATLAB HW 11 problem using Switch Case and Input commands
Write a script file that calculates...
asked 5 hours ago -
Considering gravitational time dilation, calculate the time that
passes in Earth’s surface while 1 hour passes...
asked 6 hours ago -
Minitab Problem: Take the Lake Hume June rainfall data and find
use the processes outlined in...
asked 7 hours ago -
X Company is trying to decide whether to continue using old
equipment to make Product A...
asked 7 hours ago