Using MATLAB, Please read carefully, EXPLAIN CODE AND ANSWERS, DISCUSS RESULTS, I NEED EVERY PART
Homework Answers
clc;close all;clear all;
%plot s(t)
figure(1)
t=0:0.001:0.1
A1=10;A2=3;f1=10;f2=40;
st=(A1*(cos(2*pi*f1*t)))+(A2*(cos(2*pi*f2*t)))
subplot(321)
plot(t,st)
xlabel('t')
ylabel('s(t)')
title('s(t)')
%FFT of s(t)
%Frequency spectrum of S(f)
subplot(322)
Sf=fft(st)
k=0:1:length(t)-1
stem(k,real(Sf),'m')
title('Real(Sf)')
xlabel('k')
ylabel('real(Sf)')
subplot(323)
stem(k,imag(Sf),'g')
title('Imag(Sf)')
xlabel('k')
ylabel('Imag(Sf)')
%Remove high frequency component&perform ifft
Sf(5)=0;Sf(98)=0%Choose lowest amplitude peaks from real(Sf)
G=Sf
g=ifft(G)
subplot(324)
plot(t,g,'b')
title('Recovered signal g(t) by ifft')
xlabel('t')
ylabel('g(t)')
%Frequency spectrum of G(f)
subplot(325)
k=0:1:length(t)-1
stem(k,real(G),'m')
title('Real(Gf)')
xlabel('k')
ylabel('real(Gf)')
subplot(326)
stem(k,imag(G),'g')
title('Imag(Gf)')
xlabel('k')
ylabel('Imag(Gf)')
Add Answer to:
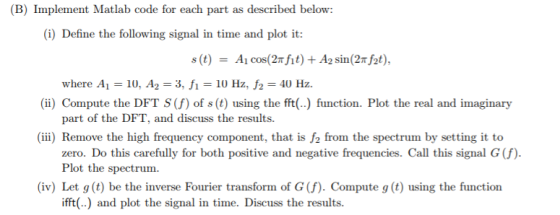
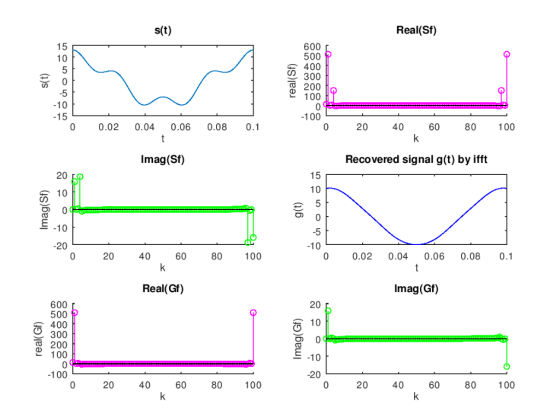
(B) Implement Matlab code for each part as described below: i) Define the following signal in tim...
Write a MATLAB code for the question below. There is an initial signal containing 60 Hz...
 Write a MATLAB code for the question below.
There is an initial signal containing 60 Hz sinusoid of amplitude 0.8 and a 150 Hz sinusoid of amplitude 1.2 corrupted by a noise - using the randn command - (zero-mean white noise with variance of 4). Plot the noisy signal in the time domain. After that compute the Fourier transform -using the fft command of the noisy signal, compute the two-sided spectrum. Define the frequency domain f and plot the single-sided...
Write a MATLAB code for the question below.
There is an initial signal containing 60 Hz sinusoid of amplitude 0.8 and a 150 Hz sinusoid of amplitude 1.2 corrupted by a noise - using the randn command - (zero-mean white noise with variance of 4). Plot the noisy signal in the time domain. After that compute the Fourier transform -using the fft command of the noisy signal, compute the two-sided spectrum. Define the frequency domain f and plot the single-sided...
MATLAB Code Question alpha = 2.3 beta = 4.3 zeta = 9.1 PROBLEM 4 (20 points). Consider three sinusoids with the following amplitudes and phases a.cs(2n(500t)) β.cos(2n(500t) +0.5r) x1n] x2[n] rn...
 MATLAB Code Question
alpha = 2.3
beta = 4.3
zeta = 9.1
PROBLEM 4 (20 points). Consider three sinusoids with the following amplitudes and phases a.cs(2n(500t)) β.cos(2n(500t) +0.5r) x1n] x2[n] rn = cos(2(500t)0.75) Create a MATLAB program to sample each sinusoid and generate a sum of three sinusoids, that is using a sampling rate of 8,000 Hz over a range of 0.1 seconds Use the MATLAB function stem) to plot r[n] for the first 20 samples Use the MATLAB function...
MATLAB Code Question
alpha = 2.3
beta = 4.3
zeta = 9.1
PROBLEM 4 (20 points). Consider three sinusoids with the following amplitudes and phases a.cs(2n(500t)) β.cos(2n(500t) +0.5r) x1n] x2[n] rn = cos(2(500t)0.75) Create a MATLAB program to sample each sinusoid and generate a sum of three sinusoids, that is using a sampling rate of 8,000 Hz over a range of 0.1 seconds Use the MATLAB function stem) to plot r[n] for the first 20 samples Use the MATLAB function...
Now use MATLAB to generate and plot 15seconds of this signal in the time-domain.Use the fft()...
 Now use MATLAB to generate and plot 15seconds of this signal
in the time-domain.Use the fft() function to find the fourier
transform of this signal and plot its magnitude spectrum
School of Engineering Task 3 - The Fourier Transform: Scaling property Exercise: Let's take a look now at using the Fourier transform on aperiodic signals. Consider the real exponential signal from the discharging capacitor in tas 3 of laboratory 1 which was found to be: You(t)=e"u(t) Begin by calculating manually...
Now use MATLAB to generate and plot 15seconds of this signal
in the time-domain.Use the fft() function to find the fourier
transform of this signal and plot its magnitude spectrum
School of Engineering Task 3 - The Fourier Transform: Scaling property Exercise: Let's take a look now at using the Fourier transform on aperiodic signals. Consider the real exponential signal from the discharging capacitor in tas 3 of laboratory 1 which was found to be: You(t)=e"u(t) Begin by calculating manually...
3) Given three sinusoids with the following amplitude and phases (t)-Scos(2x (1200+0.25x) a. Create a MATLAB...
 3) Given three sinusoids with the following amplitude and phases (t)-Scos(2x (1200+0.25x) a. Create a MATLAB program to sample each sinusoid and generate a sum of three sinusoids, that is, х(n)=x1(nHx:(n)+xy(n), using a sampling rate of 8000 Hz, and plot the sum x(n) over a range of time that will exhibit approximately 0.1 second. (10 pts) b. Use the MATLAB function fO to compute DFT coefficients, and plot and examine the spectrum of the signal x(n).(10 pts Write a MATLAB...
This is a MATLAB Question. Below is my base code for a Fourier Series of a...
 This is a MATLAB Question. Below is my base code for a Fourier
Series of a half triangle wave.
So I am being asked to isolate the first 8 components so that
only those first 8 components of the half triangle function are
calculated by MATLAB fft function, and then afterwards I am asked
to do the same thing but with the first 20 components rather than
the first 8. How do I isolate the first x number of components...
This is a MATLAB Question. Below is my base code for a Fourier
Series of a half triangle wave.
So I am being asked to isolate the first 8 components so that
only those first 8 components of the half triangle function are
calculated by MATLAB fft function, and then afterwards I am asked
to do the same thing but with the first 20 components rather than
the first 8. How do I isolate the first x number of components...
Write a Matlab code to generate the signal y(t)=10*(cos(2*pi*f1*t)+ cos(2*pi*f2*t)+ cos(2*pi*f3*t)), where f1=500 Hz, f2=750 Hz...
Write a Matlab code to generate the signal y(t)=10*(cos(2*pi*f1*t)+ cos(2*pi*f2*t)+ cos(2*pi*f3*t)), where f1=500 Hz, f2=750 Hz and f3=1000 Hz. Plot the signal in time domain. Sketch the Fourier transform of the signal with appropriately generating frequency axis. Apply an appropriate filter to y(t) so that signal part with frequency f1 can be extracted. Sketch the Fourier transform of the extracted signal. Apply an appropriate filter to y(t) so that signal part with frequency f2 can be extracted. Sketch the Fourier...
solve it using matlab.. show the code 6.1-4 A signal g(t) = sinca (571) is sampled...
 solve it using matlab.. show the code
6.1-4 A signal g(t) = sinca (571) is sampled (using uniformly spaced impulses) at a rate of (1) 5 Hz, (ii) 10 Hz; (ii) 20 Hz. For each of the three cases: (a) Sketch the sampled signal. (b) Sketch the spectrum of the sampled signal
solve it using matlab.. show the code
6.1-4 A signal g(t) = sinca (571) is sampled (using uniformly spaced impulses) at a rate of (1) 5 Hz, (ii) 10 Hz; (ii) 20 Hz. For each of the three cases: (a) Sketch the sampled signal. (b) Sketch the spectrum of the sampled signal
in Matlab Implement Matlab code for the periodic signals given by their Fourier Series approximation as...
 in Matlab
Implement Matlab code for the periodic signals given by their Fourier Series approximation as follows: 100 k=-100 100 E2 sine alytai".트.h(블)-a* Implement the sum as given by the above equations. Note that in Matlab, array indices are pos- itive and start at 1. Define the negative coefficients carefully. Plot the signals, and the real and imaginary part of the signals ri (t) and x2 (t). In each case, determine the following: (a) Are the signals real? (b) Are...
in Matlab
Implement Matlab code for the periodic signals given by their Fourier Series approximation as follows: 100 k=-100 100 E2 sine alytai".트.h(블)-a* Implement the sum as given by the above equations. Note that in Matlab, array indices are pos- itive and start at 1. Define the negative coefficients carefully. Plot the signals, and the real and imaginary part of the signals ri (t) and x2 (t). In each case, determine the following: (a) Are the signals real? (b) Are...
3) Given three sinusoids with the following amplitude and phases (t)-Scos(2x (1200+0.25x) a. Crea...
 3) Given three sinusoids with the following amplitude and phases (t)-Scos(2x (1200+0.25x) a. Create a MATLAB program to sample each sinusoid and generate a sum of three sinusoids, that is, х(n)=x1(nHx:(n)+xy(n), using a sampling rate of 8000 Hz, and plot the sum x(n) over a range of time that will exhibit approximately 0.1 second. (10 pts) b. Use the MATLAB function fO to compute DFT coefficients, and plot and examine the spectrum of the signal x(n).(10 pts Write a MATLAB...
Problem 2 (Spectrum of a rectangular signal): In this problem, the amplitude spectrum of the signal 1 or Ot 2 ms x(t)- 0 otherwise is to be analysed (b) Numerical calculation of the spectrum: (i) Us...
 Problem 2 (Spectrum of a rectangular signal): In this problem, the amplitude spectrum of the signal 1 or Ot 2 ms x(t)- 0 otherwise is to be analysed (b) Numerical calculation of the spectrum: (i) Use Matlab to generate and plot a vector containing the sample values of the rectangular signal defined in (2) sampled at f 8kHz. Choose the number N of sample values so that it is a power of 2 and that the signal duration is at...
 Write a MATLAB code for the question below.
There is an initial signal containing 60 Hz sinusoid of amplitude 0.8 and a 150 Hz sinusoid of amplitude 1.2 corrupted by a noise - using the randn command - (zero-mean white noise with variance of 4). Plot the noisy signal in the time domain. After that compute the Fourier transform -using the fft command of the noisy signal, compute the two-sided spectrum. Define the frequency domain f and plot the single-sided...
Write a MATLAB code for the question below.
There is an initial signal containing 60 Hz sinusoid of amplitude 0.8 and a 150 Hz sinusoid of amplitude 1.2 corrupted by a noise - using the randn command - (zero-mean white noise with variance of 4). Plot the noisy signal in the time domain. After that compute the Fourier transform -using the fft command of the noisy signal, compute the two-sided spectrum. Define the frequency domain f and plot the single-sided...
 MATLAB Code Question
alpha = 2.3
beta = 4.3
zeta = 9.1
PROBLEM 4 (20 points). Consider three sinusoids with the following amplitudes and phases a.cs(2n(500t)) β.cos(2n(500t) +0.5r) x1n] x2[n] rn = cos(2(500t)0.75) Create a MATLAB program to sample each sinusoid and generate a sum of three sinusoids, that is using a sampling rate of 8,000 Hz over a range of 0.1 seconds Use the MATLAB function stem) to plot r[n] for the first 20 samples Use the MATLAB function...
MATLAB Code Question
alpha = 2.3
beta = 4.3
zeta = 9.1
PROBLEM 4 (20 points). Consider three sinusoids with the following amplitudes and phases a.cs(2n(500t)) β.cos(2n(500t) +0.5r) x1n] x2[n] rn = cos(2(500t)0.75) Create a MATLAB program to sample each sinusoid and generate a sum of three sinusoids, that is using a sampling rate of 8,000 Hz over a range of 0.1 seconds Use the MATLAB function stem) to plot r[n] for the first 20 samples Use the MATLAB function...
 Now use MATLAB to generate and plot 15seconds of this signal
in the time-domain.Use the fft() function to find the fourier
transform of this signal and plot its magnitude spectrum
School of Engineering Task 3 - The Fourier Transform: Scaling property Exercise: Let's take a look now at using the Fourier transform on aperiodic signals. Consider the real exponential signal from the discharging capacitor in tas 3 of laboratory 1 which was found to be: You(t)=e"u(t) Begin by calculating manually...
Now use MATLAB to generate and plot 15seconds of this signal
in the time-domain.Use the fft() function to find the fourier
transform of this signal and plot its magnitude spectrum
School of Engineering Task 3 - The Fourier Transform: Scaling property Exercise: Let's take a look now at using the Fourier transform on aperiodic signals. Consider the real exponential signal from the discharging capacitor in tas 3 of laboratory 1 which was found to be: You(t)=e"u(t) Begin by calculating manually...
 3) Given three sinusoids with the following amplitude and phases (t)-Scos(2x (1200+0.25x) a. Create a MATLAB program to sample each sinusoid and generate a sum of three sinusoids, that is, х(n)=x1(nHx:(n)+xy(n), using a sampling rate of 8000 Hz, and plot the sum x(n) over a range of time that will exhibit approximately 0.1 second. (10 pts) b. Use the MATLAB function fO to compute DFT coefficients, and plot and examine the spectrum of the signal x(n).(10 pts Write a MATLAB...
 This is a MATLAB Question. Below is my base code for a Fourier
Series of a half triangle wave.
So I am being asked to isolate the first 8 components so that
only those first 8 components of the half triangle function are
calculated by MATLAB fft function, and then afterwards I am asked
to do the same thing but with the first 20 components rather than
the first 8. How do I isolate the first x number of components...
This is a MATLAB Question. Below is my base code for a Fourier
Series of a half triangle wave.
So I am being asked to isolate the first 8 components so that
only those first 8 components of the half triangle function are
calculated by MATLAB fft function, and then afterwards I am asked
to do the same thing but with the first 20 components rather than
the first 8. How do I isolate the first x number of components...
 solve it using matlab.. show the code
6.1-4 A signal g(t) = sinca (571) is sampled (using uniformly spaced impulses) at a rate of (1) 5 Hz, (ii) 10 Hz; (ii) 20 Hz. For each of the three cases: (a) Sketch the sampled signal. (b) Sketch the spectrum of the sampled signal
solve it using matlab.. show the code
6.1-4 A signal g(t) = sinca (571) is sampled (using uniformly spaced impulses) at a rate of (1) 5 Hz, (ii) 10 Hz; (ii) 20 Hz. For each of the three cases: (a) Sketch the sampled signal. (b) Sketch the spectrum of the sampled signal
 in Matlab
Implement Matlab code for the periodic signals given by their Fourier Series approximation as follows: 100 k=-100 100 E2 sine alytai".트.h(블)-a* Implement the sum as given by the above equations. Note that in Matlab, array indices are pos- itive and start at 1. Define the negative coefficients carefully. Plot the signals, and the real and imaginary part of the signals ri (t) and x2 (t). In each case, determine the following: (a) Are the signals real? (b) Are...
in Matlab
Implement Matlab code for the periodic signals given by their Fourier Series approximation as follows: 100 k=-100 100 E2 sine alytai".트.h(블)-a* Implement the sum as given by the above equations. Note that in Matlab, array indices are pos- itive and start at 1. Define the negative coefficients carefully. Plot the signals, and the real and imaginary part of the signals ri (t) and x2 (t). In each case, determine the following: (a) Are the signals real? (b) Are...
 3) Given three sinusoids with the following amplitude and phases (t)-Scos(2x (1200+0.25x) a. Create a MATLAB program to sample each sinusoid and generate a sum of three sinusoids, that is, х(n)=x1(nHx:(n)+xy(n), using a sampling rate of 8000 Hz, and plot the sum x(n) over a range of time that will exhibit approximately 0.1 second. (10 pts) b. Use the MATLAB function fO to compute DFT coefficients, and plot and examine the spectrum of the signal x(n).(10 pts Write a MATLAB...
 Problem 2 (Spectrum of a rectangular signal): In this problem, the amplitude spectrum of the signal 1 or Ot 2 ms x(t)- 0 otherwise is to be analysed (b) Numerical calculation of the spectrum: (i) Use Matlab to generate and plot a vector containing the sample values of the rectangular signal defined in (2) sampled at f 8kHz. Choose the number N of sample values so that it is a power of 2 and that the signal duration is at...
Most questions answered within 3 hours.
-
The probability that Janie is wearing sunglasses is 1/4. The
probability that she is wearing sunglasses...
asked 26 minutes ago -
Do you believe social media is more of a help or a hindrance in
controlling crises...
asked 44 minutes ago -
Two long, parallel wires separated by 2.85 cm carry currents in
opposite directions. The current in...
asked 23 minutes ago -
Question # 1. Develop a list of rehabilitation journals
that publish articles concerning career counseling for...
asked 35 minutes ago -
Bryant Company has a factory machine with a book value of
$85,100 and a remaining useful...
asked 37 minutes ago -
What is the default classification for federal tax purposes of a
U.S. eligible entity with one...
asked 46 minutes ago -
1. How many grams would 4.0x10²¹ atoms of calcium
weigh?
2.. Calculate the percent oxygen in...
asked 39 minutes ago -
Balance Equation
K2Cr2O7 + H2C2O4 2H2O 6 K[Cr(C2O4 )2 (H2O)2 ]2H2O + CO2 +
H2O
asked 46 minutes ago -
Select a position in the clinical laboratory and write an
appropriate job description and corresponding work...
asked 50 minutes ago -
Targeting the Bottom of the Pyramid
What are some of the broader societal pricing concerns faced...
asked 52 minutes ago -
Which of the following statements is correct? (3 marks)
a) Upon the public announcement of finding...
asked 51 minutes ago -
A wind turbine at sea level uses a 60 m radius blade to convert
a 10...
asked 1 hour ago