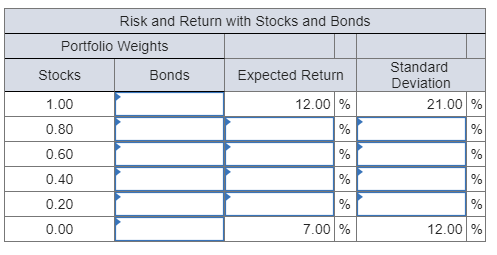
Fill in the missing information assuming a correlation of .30. (Leave no cells blank - be certain to enter "0" wherever required. Do not round intermediate calculations. Enter the portfolio weights as a decimal rounded to 2 decimal places. Enter the other answers as a percent rounded to 2 decimal places.)
Homework Answers
| Stocks | Bonds | Expected Return | Standard Deviation |
| 1 | 0 | 12.00% | 21.00% |
| 0.8 | 0.2 | 11.00% | 17.67% |
| 0.6 | 0.4 | 10.00% | 14.77% |
| 0.4 | 0.6 | 9.00% | 12.60% |
| 0.2 | 0.8 | 8.00% | 11.58% |
| 0 | 1 | 7.00% | 12.00% |
Add Answer to:
Fill in the missing information assuming a correlation of .30. (Leave no cells blank - be certain...
a. Fill in the missing values in the table. (Leave no cells blank - be certain...
 a. Fill in the missing values in the table. (Leave no cells
blank - be certain to enter 0 wherever required. Do not round
intermediate calculations and round your answers to 2 decimal
places, e.g., 32.16.)
b-1. What is the expected return of Firm A? (Do not round
intermediate calculations and enter your answer as a percent
rounded to 2 decimal places, e.g., 32.16.)
b-2. What is your investment recommendation regarding Firm A for
someone with a well-diversified portfolio? Sell...
a. Fill in the missing values in the table. (Leave no cells
blank - be certain to enter 0 wherever required. Do not round
intermediate calculations and round your answers to 2 decimal
places, e.g., 32.16.)
b-1. What is the expected return of Firm A? (Do not round
intermediate calculations and enter your answer as a percent
rounded to 2 decimal places, e.g., 32.16.)
b-2. What is your investment recommendation regarding Firm A for
someone with a well-diversified portfolio? Sell...
a. Fill in the missing values in the table. (Leave no cells blank - be certain...
a. Fill in the missing values in the table. (Leave no cells blank - be certain to enter 0 wherever required. Do not round intermediate calculations and round your answers to 2 decimal places, e.g., 32.16.) Security Expected Return Standard Deviation Correlation* Beta Firm A .102 .39 .77 Firm B .148 .58 1.32 Firm C .168 .57 .43 The market portfolio .12 .20 The risk-free asset .05 *With the market portfolio. b-1. According to the CAPM, what is the expected...
Part D and E please 2. Consider the information in Table 1. Table 1 Correlation with...
 Part D and E please
2. Consider the information in Table 1. Table 1 Correlation with market portfolio 0.20 0.80 1.00 0.00 Standard deviation Return Beta Stock 1 Stock 2 Market portfolio Risk-free asset 5% 12% 8% 0% 16% 2% 0 (a) Consider Table 1. Calculate betas for stock I and stock 2 (b) Consider Table 1. Compute the equilibrium expected return according to the CAPM for stocks 1 and 2 (c) Consider Table 1 and the equilibrium expected returns...
Part D and E please
2. Consider the information in Table 1. Table 1 Correlation with market portfolio 0.20 0.80 1.00 0.00 Standard deviation Return Beta Stock 1 Stock 2 Market portfolio Risk-free asset 5% 12% 8% 0% 16% 2% 0 (a) Consider Table 1. Calculate betas for stock I and stock 2 (b) Consider Table 1. Compute the equilibrium expected return according to the CAPM for stocks 1 and 2 (c) Consider Table 1 and the equilibrium expected returns...
Consider the following scenario analysis: Scenario Recession Normal economy Boom Rate of Return Probability Stocks Bonds...
 Consider the following scenario analysis: Rate of ReturnScenarioProbabilityStocksBondsRecession0.20-5%14% Normal economy 0.60158Boom0.20 254Assume a portfolio with weights of .60 in stocks and .40 in bonds. a. What is the rate of return on the portfolio in each scenario? (Do not round percent rounded to 1 decimal place.) Rate of Return Recession Normal economy Boomb. What are the expected rate of return and standard deviation of the portfolio? (Do not round intermediate calculations. Enter your answer as...
You have been provided the following data about the securities of three firms, the market portfolio, and the risk-free...
 You have been provided the following data about the securities of three firms, the market portfolio, and the risk-free asset: a. Fill in the missing values in the table. (Leave no cells blank - be certain to enter o wherever required. Do not round intermediate calculations and round your answers to 2 decimal places, e.g., 32.16.) Expected Return Standard Deviation Security Correlation* Beta Firm A 0.120 0.21 0.96 Firm B 0.40 0.130 1.51 Firm C The market portfolio 0.111 0.76...
2. (10 marks) Fill in the missing information assuming a correlation of -0.1. Standard Estimated Return...
 2. (10 marks) Fill in the missing information assuming a correlation of -0.1. Standard Estimated Return 13% 31% Portfolio Weights Stock A Stock B 100% 80% 60% 40% 20% 0% T 16% 42% Discuss the diversification of this 2-stock portfolio and illustrate in a graph the risk-return trade-off.
I would like part d and e answered please 2. Consider the information in Table 1...
 I would like part d and e answered please
2. Consider the information in Table 1 Table 1 Correlation with market portfolio 0.20 0.80 1.00 0.00 Standard deviation Return Beta Stock 1 Stock 2 Market portfolio 6% 12% 8% 0% 16% 2% Risk-free asset 0 (a) Consider Table 1. Calculate betas for stock 1 and stock 2. (b) Consider Table 1. Compute the equilibrium expected return according to the CAPM for stocks 1 and 2. (c) Consider Table 1 and...
I would like part d and e answered please
2. Consider the information in Table 1 Table 1 Correlation with market portfolio 0.20 0.80 1.00 0.00 Standard deviation Return Beta Stock 1 Stock 2 Market portfolio 6% 12% 8% 0% 16% 2% Risk-free asset 0 (a) Consider Table 1. Calculate betas for stock 1 and stock 2. (b) Consider Table 1. Compute the equilibrium expected return according to the CAPM for stocks 1 and 2. (c) Consider Table 1 and...
You have been provided the following data about the securities of three firms, the market portfolio, and the risk-fr...
You have been provided the following data about the securities of three firms, the market portfolio, and the risk-free asset: a. Fill in the missing values in the table. (Leave no cells blank - be certain to enter 0 wherever required. Do not round intermediate calculations and round your answers to 2 decimal places, e.g., 32.16.) Security Expected Return Standard Deviation Correlations Beta Firm A 0.101 0.40 0.76 Firm B 0.149 0.59 1.31 Firm C 0.169 0.56 0.44 The...
please make sure all answers are rounded to 2 decimal points. thanks! Suppose the expected returns...
 please make sure all answers are rounded to 2 decimal points.
thanks!
Suppose the expected returns and standard deviations of Stocks A and Bare E(RA) 100, E(Ra) 160, OA370, and OB 630 a-1. Calculate the expected return of a portfolio that is composed of 45 percent A and 55 percent Bwhen the correlation between the returns on A and Bis .60. (Do not round intermediate calculations. Enter your answer as a percent rounded to 2 decimal places, e.g, 32.16.) %...
please make sure all answers are rounded to 2 decimal points.
thanks!
Suppose the expected returns and standard deviations of Stocks A and Bare E(RA) 100, E(Ra) 160, OA370, and OB 630 a-1. Calculate the expected return of a portfolio that is composed of 45 percent A and 55 percent Bwhen the correlation between the returns on A and Bis .60. (Do not round intermediate calculations. Enter your answer as a percent rounded to 2 decimal places, e.g, 32.16.) %...
onsider the following information about three stocks: State of Economy Probability of State of Economy Rate...
onsider the following information about three stocks: State of Economy Probability of State of Economy Rate of Return if State Occurs Stock A Stock B Stock C Boom 0.20 0.20 0.32 0.54 Normal 0.45 0.18 0.16 0.14 Bust 0.35 0.02 −0.34 −0.42 a-1. If your portfolio is invested 40% each in A and B and 20% in C, what is the portfolio expected return? (Do not round intermediate calculations. Enter the answer as a percent rounded to 2 decimal places.)...
 a. Fill in the missing values in the table. (Leave no cells
blank - be certain to enter 0 wherever required. Do not round
intermediate calculations and round your answers to 2 decimal
places, e.g., 32.16.)
b-1. What is the expected return of Firm A? (Do not round
intermediate calculations and enter your answer as a percent
rounded to 2 decimal places, e.g., 32.16.)
b-2. What is your investment recommendation regarding Firm A for
someone with a well-diversified portfolio? Sell...
a. Fill in the missing values in the table. (Leave no cells
blank - be certain to enter 0 wherever required. Do not round
intermediate calculations and round your answers to 2 decimal
places, e.g., 32.16.)
b-1. What is the expected return of Firm A? (Do not round
intermediate calculations and enter your answer as a percent
rounded to 2 decimal places, e.g., 32.16.)
b-2. What is your investment recommendation regarding Firm A for
someone with a well-diversified portfolio? Sell...
 Part D and E please
2. Consider the information in Table 1. Table 1 Correlation with market portfolio 0.20 0.80 1.00 0.00 Standard deviation Return Beta Stock 1 Stock 2 Market portfolio Risk-free asset 5% 12% 8% 0% 16% 2% 0 (a) Consider Table 1. Calculate betas for stock I and stock 2 (b) Consider Table 1. Compute the equilibrium expected return according to the CAPM for stocks 1 and 2 (c) Consider Table 1 and the equilibrium expected returns...
Part D and E please
2. Consider the information in Table 1. Table 1 Correlation with market portfolio 0.20 0.80 1.00 0.00 Standard deviation Return Beta Stock 1 Stock 2 Market portfolio Risk-free asset 5% 12% 8% 0% 16% 2% 0 (a) Consider Table 1. Calculate betas for stock I and stock 2 (b) Consider Table 1. Compute the equilibrium expected return according to the CAPM for stocks 1 and 2 (c) Consider Table 1 and the equilibrium expected returns...
 Consider the following scenario analysis: Rate of ReturnScenarioProbabilityStocksBondsRecession0.20-5%14% Normal economy 0.60158Boom0.20 254Assume a portfolio with weights of .60 in stocks and .40 in bonds. a. What is the rate of return on the portfolio in each scenario? (Do not round percent rounded to 1 decimal place.) Rate of Return Recession Normal economy Boomb. What are the expected rate of return and standard deviation of the portfolio? (Do not round intermediate calculations. Enter your answer as...
 You have been provided the following data about the securities of three firms, the market portfolio, and the risk-free asset: a. Fill in the missing values in the table. (Leave no cells blank - be certain to enter o wherever required. Do not round intermediate calculations and round your answers to 2 decimal places, e.g., 32.16.) Expected Return Standard Deviation Security Correlation* Beta Firm A 0.120 0.21 0.96 Firm B 0.40 0.130 1.51 Firm C The market portfolio 0.111 0.76...
 2. (10 marks) Fill in the missing information assuming a correlation of -0.1. Standard Estimated Return 13% 31% Portfolio Weights Stock A Stock B 100% 80% 60% 40% 20% 0% T 16% 42% Discuss the diversification of this 2-stock portfolio and illustrate in a graph the risk-return trade-off.
 I would like part d and e answered please
2. Consider the information in Table 1 Table 1 Correlation with market portfolio 0.20 0.80 1.00 0.00 Standard deviation Return Beta Stock 1 Stock 2 Market portfolio 6% 12% 8% 0% 16% 2% Risk-free asset 0 (a) Consider Table 1. Calculate betas for stock 1 and stock 2. (b) Consider Table 1. Compute the equilibrium expected return according to the CAPM for stocks 1 and 2. (c) Consider Table 1 and...
I would like part d and e answered please
2. Consider the information in Table 1 Table 1 Correlation with market portfolio 0.20 0.80 1.00 0.00 Standard deviation Return Beta Stock 1 Stock 2 Market portfolio 6% 12% 8% 0% 16% 2% Risk-free asset 0 (a) Consider Table 1. Calculate betas for stock 1 and stock 2. (b) Consider Table 1. Compute the equilibrium expected return according to the CAPM for stocks 1 and 2. (c) Consider Table 1 and...
 please make sure all answers are rounded to 2 decimal points.
thanks!
Suppose the expected returns and standard deviations of Stocks A and Bare E(RA) 100, E(Ra) 160, OA370, and OB 630 a-1. Calculate the expected return of a portfolio that is composed of 45 percent A and 55 percent Bwhen the correlation between the returns on A and Bis .60. (Do not round intermediate calculations. Enter your answer as a percent rounded to 2 decimal places, e.g, 32.16.) %...
please make sure all answers are rounded to 2 decimal points.
thanks!
Suppose the expected returns and standard deviations of Stocks A and Bare E(RA) 100, E(Ra) 160, OA370, and OB 630 a-1. Calculate the expected return of a portfolio that is composed of 45 percent A and 55 percent Bwhen the correlation between the returns on A and Bis .60. (Do not round intermediate calculations. Enter your answer as a percent rounded to 2 decimal places, e.g, 32.16.) %...
Most questions answered within 3 hours.
-
An empty test tube weighs 15.923 grams. Then,
MgCl2•6H2O is added into the test tube. After...
asked 17 minutes ago -
Please answer true or false. Words
cannot be changed or added in to make it true...
asked 16 minutes ago -
(a) A piston at 6.1 atm contains a gas that occupies a volume of
3.5 L....
asked 17 minutes ago -
Assume memory access is 10 units of time and disk access is
10000 units of time....
asked 36 minutes ago -
1. Are all good samples random?
2. Magazines often report surveys giving statistics such as “63%...
asked 57 minutes ago -
Under all the various types of market structures, firms
must eventually earn some economic profits for...
asked 43 minutes ago -
Consider the following fitness regime for a single locus trait
with two co-dominant alleles: w11 =...
asked 48 minutes ago -
A large cable company reports the following.
80% of its customers subscribe to its cable TV...
asked 1 hour ago -
Please answer the question in brief.
Discuss the role of ERP in organizations. Are ERP tools...
asked 49 minutes ago -
Discuss the pros and cons of collaborative software such
as SameTime. Does it increase productivity? What...
asked 1 hour ago -
Buying your in-laws a gift because it’s expected is
due to the ____________ motive of gift-giving....
asked 1 hour ago -
Calculate the expected value, the variance, and the standard
deviation of the given random variable X....
asked 1 hour ago