Hi,
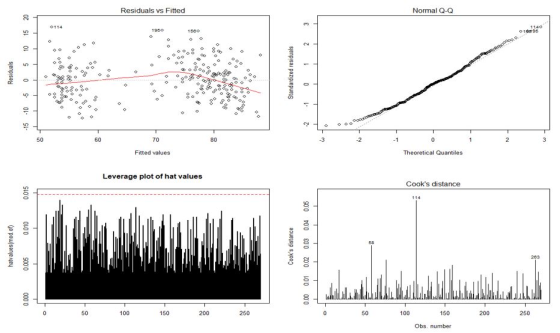
Could someone please give detail explanation of the following graphs. I try to understand what assumptions are being violate here ie (constant variance, independent residuals, linearity) sample size is n=270 observation. I think the variance in top left graph is not constant; there is huge gap in middle of data, but i do not know how to explain formally,
I really looking for someone who has a strong understanding of statistics to provide justification. I want to understand if assumptions being violated. nomral qq looks fine becasue no major deivation away from normality.
Can you please exaplin how in this example, resdiduals vs fitted, cooks distance, and leverage plot all relate.
Please give justification with answer ,, I want to better understand, many thanks.
Homework Answers
The Residual vs Fitted plot checks if the relation between variables is linear and whether there is homoscedasticity. A good plot is one where the points are distributed around the 0-line randomly and in an even spread(for homoscadasticity). In any regression you cannot predict the error of an upcoming point but studying previous data you can say if it is random. This plot checks the consistency of observed residuals with random error. If there is a pattern, then it suggests that error is not entirely random, there are physical and assignable causes that are affecting the value of the response variable.
This assignable error can be due to leverage points or outlier observations in the data. Leverage Points are (if simply put) extreme observations in the predictor values and Outliers are extreme response variable values. Both these values can unduly affect the regression line that hampers future prediction.
The Leverage Plot of Hatvalues is a measure of distance between each X and the mean of X. It indicates potential predictor value outliers(Leverage Points) in its plot. Cooks distance shows how much our model will change if a particular observation would be deleted. So a high Cooks Distance would indicate a potential outlier in Y.
The graphs are related in a sense that the first graph checks for the error distribution. And the next two plots are then used to detect the data points that may be responsible.
In the given graphs, the residual vs fitted plot clearly indicates a pattern and an uneven spread which means it violates assumptions. Then moving on to the Leverage Plot, we do not find any point at any extremity so we can assume there are no Leverage values, and from the Cooks Distance plot, we see 3 observations (58,114,268) that are possible outliers(Y) and the most influential among them is Observation 114.
Add Answer to:
Hi, Could someone please give detail explanation of the following graphs. I try to understand wha...
HI I trying to understand better the plots below. Only have small sample size of 21 observation i...
 HI I trying to understand better the plots below.
Only have small sample size of 21 observation in data using. I
not see anything drastic maybe but for thick tail in qqplot
Does this mean that linear model should not be use? Many
thank.
I trying to better interpret these question, and really want to
understand.
Please could you give feedback. Thankyou
Residuals vs Fitted Normal Q-Q 20◇ 2.5 3.0 3.5 4.0 4.5 -2 Fitted values Theoretical Quantiles Leverage plot...
HI I trying to understand better the plots below.
Only have small sample size of 21 observation in data using. I
not see anything drastic maybe but for thick tail in qqplot
Does this mean that linear model should not be use? Many
thank.
I trying to better interpret these question, and really want to
understand.
Please could you give feedback. Thankyou
Residuals vs Fitted Normal Q-Q 20◇ 2.5 3.0 3.5 4.0 4.5 -2 Fitted values Theoretical Quantiles Leverage plot...
i do not know how to interpret these graphs. please when exlaining do not write the definition and instead can you write whats going on in the graphs like the errors. alos air pop in the graph means a...
 i
do not know how to interpret these graphs. please when exlaining do
not write the definition and instead can you write whats going on
in the graphs like the errors. alos air pop in the graph means air
pollution
Residuals vs Fitted 0151 3 OO Oo 1850 450 60 65 70 75 80 Fitted values Im(Malelife GDP + ruralpop + airpop) Normal Q-Q 1510 045 0185 2 -3 2 -1 1 3 Theoretical Quantiles Im(Malelife- GDP+ ruralpo+ airpop) Scale-Location...
i
do not know how to interpret these graphs. please when exlaining do
not write the definition and instead can you write whats going on
in the graphs like the errors. alos air pop in the graph means air
pollution
Residuals vs Fitted 0151 3 OO Oo 1850 450 60 65 70 75 80 Fitted values Im(Malelife GDP + ruralpop + airpop) Normal Q-Q 1510 045 0185 2 -3 2 -1 1 3 Theoretical Quantiles Im(Malelife- GDP+ ruralpo+ airpop) Scale-Location...
194 6 My boss has just asked if my recent regression analysis on political success meets...
 194 6 My boss has just asked if my recent regression analysis on political success meets the assumptions of linear regression. I assessed 50 politicians on their speech writing skills and compared it against their election success. Worryingly, my dog ate my data plot and my computer is out of battery - but I do have these plots of residual analysis to hand. What is my conclusion? 1 OO 0 Studentized Residuals -1 100 -2 OF 40 50 60 70...
Can you give me code for R for question (a) and (d)? I have the plots...
 Can you give me code for R for question (a) and (d)?
I have the plots but I do not know how the codes work.
for (a)
(d-1)
(d-2)
A study was conducted to explore the effects of ethanol on sleep time. Fifteen rats were randomized to one of three treatments. Treatment 1 got only water (conto). Treatment 2 got 1g of ethanol per kg of body weight, and treatment 3 got 2g/kg of ethanol. The amount of REM sleep...
Can you give me code for R for question (a) and (d)?
I have the plots but I do not know how the codes work.
for (a)
(d-1)
(d-2)
A study was conducted to explore the effects of ethanol on sleep time. Fifteen rats were randomized to one of three treatments. Treatment 1 got only water (conto). Treatment 2 got 1g of ethanol per kg of body weight, and treatment 3 got 2g/kg of ethanol. The amount of REM sleep...
could someone answer these questions please? it'd be awesome I can't figure out the error, if...
 could someone answer these questions please? it'd be
awesome
I can't figure out the error, if someone can help with
that it'd be nice too
Lab 4: Constant Acceleration Experiment 1: Rolling Ball Questions 1 Explain why Equation (4.2) implies that the slope of the x vs. ' graph isn't equal to the ball's acceleration - 1. 2 Which measurement or measurements seem primarily responsible for the discrepancy between the theoretical and experimental accelerations? Why? (Intel CORE 15 Bu Gen...
could someone answer these questions please? it'd be
awesome
I can't figure out the error, if someone can help with
that it'd be nice too
Lab 4: Constant Acceleration Experiment 1: Rolling Ball Questions 1 Explain why Equation (4.2) implies that the slope of the x vs. ' graph isn't equal to the ball's acceleration - 1. 2 Which measurement or measurements seem primarily responsible for the discrepancy between the theoretical and experimental accelerations? Why? (Intel CORE 15 Bu Gen...
Could someone please help with this problem parts a-f 2. Use Figure 1 and Table 1...
 Could someone
please help with this problem parts a-f
2. Use Figure 1 and Table 1 for the following a) Compute the vertical effective stress (o) in kN/m2 at the center of the clay layer prior to the construction of the footing. [Note: To compute c., you will first have to use the weight-volume relationships to compute the unit weight of the clay.] b) Assuming B 15 m, L 2.5 m, and Q-120 kN, use the Boussinesq procedure to determine...
Could someone
please help with this problem parts a-f
2. Use Figure 1 and Table 1 for the following a) Compute the vertical effective stress (o) in kN/m2 at the center of the clay layer prior to the construction of the footing. [Note: To compute c., you will first have to use the weight-volume relationships to compute the unit weight of the clay.] b) Assuming B 15 m, L 2.5 m, and Q-120 kN, use the Boussinesq procedure to determine...
Can someone help me with question 6 please? I want to know to to get the...
 Can someone help me with question 6 please? I want to know to to
get the initial and the final temperature from the graph.
1 312 Part B: Quantitative Analysis of the Dissolution of Magnesium Sulfate 5 Graph your time/temperature data by hand (as instructed) for all four experimental runs in Part B using the graph paper provided. You will be producing FOUR graphs. Label your axes, include units, title your graphs "Temperature vs Time" and scale your graphs appropriately...
Can someone help me with question 6 please? I want to know to to
get the initial and the final temperature from the graph.
1 312 Part B: Quantitative Analysis of the Dissolution of Magnesium Sulfate 5 Graph your time/temperature data by hand (as instructed) for all four experimental runs in Part B using the graph paper provided. You will be producing FOUR graphs. Label your axes, include units, title your graphs "Temperature vs Time" and scale your graphs appropriately...
the question is in last picture. i provided the lab content... I need guidance. thank you....
 the question is in last picture. i provided the lab content...
I need guidance. thank you.
INVESTIGATION 10 ROTATIONAL MOTION OBJECTIVE To determine the moment of inertia I of a heavy composite disk by plotting measured values of torque versus angular acceleration. THEORY Newton's second law states that for translational motion (motion in a straight line) an unbalanced force on an object results in an acceleration which is proportional to the mass of the object. This means that the heavier...
the question is in last picture. i provided the lab content...
I need guidance. thank you.
INVESTIGATION 10 ROTATIONAL MOTION OBJECTIVE To determine the moment of inertia I of a heavy composite disk by plotting measured values of torque versus angular acceleration. THEORY Newton's second law states that for translational motion (motion in a straight line) an unbalanced force on an object results in an acceleration which is proportional to the mass of the object. This means that the heavier...
Please Give a detailed explanation, not just an answer! I am trying to learn I'm a...
 Please Give a detailed explanation, not just an answer! I am
trying to learn I'm a UCF student "go knights"!
ECO20023
UCF, Homework 2
Module 2 Homework Q Saved Help Save & Exit Submit A Slmple Model of Productlon Exerclse 1 Mountain Mack spends his time carving fishing lures and duck decoys. If Mountain Mack spends all of his time carving fishing lures he can carve 40 lures in a week. If he spends all of his time carving duck...
Please Give a detailed explanation, not just an answer! I am
trying to learn I'm a UCF student "go knights"!
ECO20023
UCF, Homework 2
Module 2 Homework Q Saved Help Save & Exit Submit A Slmple Model of Productlon Exerclse 1 Mountain Mack spends his time carving fishing lures and duck decoys. If Mountain Mack spends all of his time carving fishing lures he can carve 40 lures in a week. If he spends all of his time carving duck...
 HI I trying to understand better the plots below.
Only have small sample size of 21 observation in data using. I
not see anything drastic maybe but for thick tail in qqplot
Does this mean that linear model should not be use? Many
thank.
I trying to better interpret these question, and really want to
understand.
Please could you give feedback. Thankyou
Residuals vs Fitted Normal Q-Q 20◇ 2.5 3.0 3.5 4.0 4.5 -2 Fitted values Theoretical Quantiles Leverage plot...
HI I trying to understand better the plots below.
Only have small sample size of 21 observation in data using. I
not see anything drastic maybe but for thick tail in qqplot
Does this mean that linear model should not be use? Many
thank.
I trying to better interpret these question, and really want to
understand.
Please could you give feedback. Thankyou
Residuals vs Fitted Normal Q-Q 20◇ 2.5 3.0 3.5 4.0 4.5 -2 Fitted values Theoretical Quantiles Leverage plot...
 i
do not know how to interpret these graphs. please when exlaining do
not write the definition and instead can you write whats going on
in the graphs like the errors. alos air pop in the graph means air
pollution
Residuals vs Fitted 0151 3 OO Oo 1850 450 60 65 70 75 80 Fitted values Im(Malelife GDP + ruralpop + airpop) Normal Q-Q 1510 045 0185 2 -3 2 -1 1 3 Theoretical Quantiles Im(Malelife- GDP+ ruralpo+ airpop) Scale-Location...
i
do not know how to interpret these graphs. please when exlaining do
not write the definition and instead can you write whats going on
in the graphs like the errors. alos air pop in the graph means air
pollution
Residuals vs Fitted 0151 3 OO Oo 1850 450 60 65 70 75 80 Fitted values Im(Malelife GDP + ruralpop + airpop) Normal Q-Q 1510 045 0185 2 -3 2 -1 1 3 Theoretical Quantiles Im(Malelife- GDP+ ruralpo+ airpop) Scale-Location...
 194 6 My boss has just asked if my recent regression analysis on political success meets the assumptions of linear regression. I assessed 50 politicians on their speech writing skills and compared it against their election success. Worryingly, my dog ate my data plot and my computer is out of battery - but I do have these plots of residual analysis to hand. What is my conclusion? 1 OO 0 Studentized Residuals -1 100 -2 OF 40 50 60 70...
 Can you give me code for R for question (a) and (d)?
I have the plots but I do not know how the codes work.
for (a)
(d-1)
(d-2)
A study was conducted to explore the effects of ethanol on sleep time. Fifteen rats were randomized to one of three treatments. Treatment 1 got only water (conto). Treatment 2 got 1g of ethanol per kg of body weight, and treatment 3 got 2g/kg of ethanol. The amount of REM sleep...
Can you give me code for R for question (a) and (d)?
I have the plots but I do not know how the codes work.
for (a)
(d-1)
(d-2)
A study was conducted to explore the effects of ethanol on sleep time. Fifteen rats were randomized to one of three treatments. Treatment 1 got only water (conto). Treatment 2 got 1g of ethanol per kg of body weight, and treatment 3 got 2g/kg of ethanol. The amount of REM sleep...
 could someone answer these questions please? it'd be
awesome
I can't figure out the error, if someone can help with
that it'd be nice too
Lab 4: Constant Acceleration Experiment 1: Rolling Ball Questions 1 Explain why Equation (4.2) implies that the slope of the x vs. ' graph isn't equal to the ball's acceleration - 1. 2 Which measurement or measurements seem primarily responsible for the discrepancy between the theoretical and experimental accelerations? Why? (Intel CORE 15 Bu Gen...
could someone answer these questions please? it'd be
awesome
I can't figure out the error, if someone can help with
that it'd be nice too
Lab 4: Constant Acceleration Experiment 1: Rolling Ball Questions 1 Explain why Equation (4.2) implies that the slope of the x vs. ' graph isn't equal to the ball's acceleration - 1. 2 Which measurement or measurements seem primarily responsible for the discrepancy between the theoretical and experimental accelerations? Why? (Intel CORE 15 Bu Gen...
 Could someone
please help with this problem parts a-f
2. Use Figure 1 and Table 1 for the following a) Compute the vertical effective stress (o) in kN/m2 at the center of the clay layer prior to the construction of the footing. [Note: To compute c., you will first have to use the weight-volume relationships to compute the unit weight of the clay.] b) Assuming B 15 m, L 2.5 m, and Q-120 kN, use the Boussinesq procedure to determine...
Could someone
please help with this problem parts a-f
2. Use Figure 1 and Table 1 for the following a) Compute the vertical effective stress (o) in kN/m2 at the center of the clay layer prior to the construction of the footing. [Note: To compute c., you will first have to use the weight-volume relationships to compute the unit weight of the clay.] b) Assuming B 15 m, L 2.5 m, and Q-120 kN, use the Boussinesq procedure to determine...
 Can someone help me with question 6 please? I want to know to to
get the initial and the final temperature from the graph.
1 312 Part B: Quantitative Analysis of the Dissolution of Magnesium Sulfate 5 Graph your time/temperature data by hand (as instructed) for all four experimental runs in Part B using the graph paper provided. You will be producing FOUR graphs. Label your axes, include units, title your graphs "Temperature vs Time" and scale your graphs appropriately...
Can someone help me with question 6 please? I want to know to to
get the initial and the final temperature from the graph.
1 312 Part B: Quantitative Analysis of the Dissolution of Magnesium Sulfate 5 Graph your time/temperature data by hand (as instructed) for all four experimental runs in Part B using the graph paper provided. You will be producing FOUR graphs. Label your axes, include units, title your graphs "Temperature vs Time" and scale your graphs appropriately...
 the question is in last picture. i provided the lab content...
I need guidance. thank you.
INVESTIGATION 10 ROTATIONAL MOTION OBJECTIVE To determine the moment of inertia I of a heavy composite disk by plotting measured values of torque versus angular acceleration. THEORY Newton's second law states that for translational motion (motion in a straight line) an unbalanced force on an object results in an acceleration which is proportional to the mass of the object. This means that the heavier...
the question is in last picture. i provided the lab content...
I need guidance. thank you.
INVESTIGATION 10 ROTATIONAL MOTION OBJECTIVE To determine the moment of inertia I of a heavy composite disk by plotting measured values of torque versus angular acceleration. THEORY Newton's second law states that for translational motion (motion in a straight line) an unbalanced force on an object results in an acceleration which is proportional to the mass of the object. This means that the heavier...
 Please Give a detailed explanation, not just an answer! I am
trying to learn I'm a UCF student "go knights"!
ECO20023
UCF, Homework 2
Module 2 Homework Q Saved Help Save & Exit Submit A Slmple Model of Productlon Exerclse 1 Mountain Mack spends his time carving fishing lures and duck decoys. If Mountain Mack spends all of his time carving fishing lures he can carve 40 lures in a week. If he spends all of his time carving duck...
Please Give a detailed explanation, not just an answer! I am
trying to learn I'm a UCF student "go knights"!
ECO20023
UCF, Homework 2
Module 2 Homework Q Saved Help Save & Exit Submit A Slmple Model of Productlon Exerclse 1 Mountain Mack spends his time carving fishing lures and duck decoys. If Mountain Mack spends all of his time carving fishing lures he can carve 40 lures in a week. If he spends all of his time carving duck...
Most questions answered within 3 hours.
-
Write the ionic equations for the first stage of salts
hydrolysis.
Anion, Cation?
Na2S
NiSO4
K2SO4...
asked 43 minutes ago -
suppose there is a normally distributed population with a mean of
250 and a standard deviation...
asked 1 hour ago -
Question Three
Suppose you as project manager are using the Waterfall
development methodology on a large...
asked 2 hours ago -
Which statement is not true about welfare in Canada?
A.Benefits typically vary based on one's ability...
asked 2 hours ago -
Please help me with FLOWCHART and UML diagram for class,
thank you!
#include <iostream>
#include <fstream>...
asked 3 hours ago -
3. Describe the “logic circuit” of the Lac operon. Which
proteins are bound or not to...
asked 3 hours ago -
Ayesha’s adjusted gross income is $60,000 in 2019. She donated a
piece of artwork with a...
asked 3 hours ago -
For Dijkstra’s shortest path algorithm:
a. Give the Big-O time for Dijkstra’s shortest path algorithm
and...
asked 4 hours ago -
Phosphorus violates the 'octet rule' in biological molecules,
forming more covalent bonds than expected based on...
asked 4 hours ago -
A 1.3 eV electron has a 10-4 probability of tunneling
through a 2.4 eV potential barrier....
asked 4 hours ago -
What is the one ingredient that is common to being successful
with all stakeholders?
profit
trust...
asked 4 hours ago -
Write an assembly language 32 bit program that reads in lines of
text by a .txt...
asked 4 hours ago