
Homework Answers
Answer #1
ANSWER:
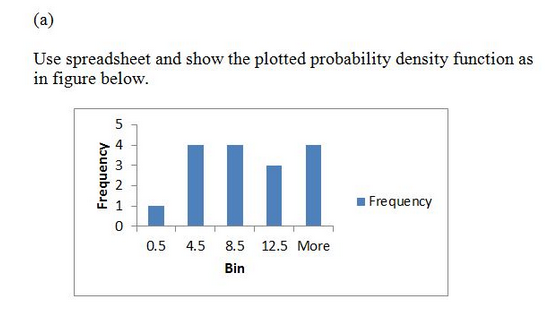
Use spreadsheet and show the plotted probability density function as in figure below. 4 CD Frequency 0 0.5 4.5 8.5 12.5 More Bin
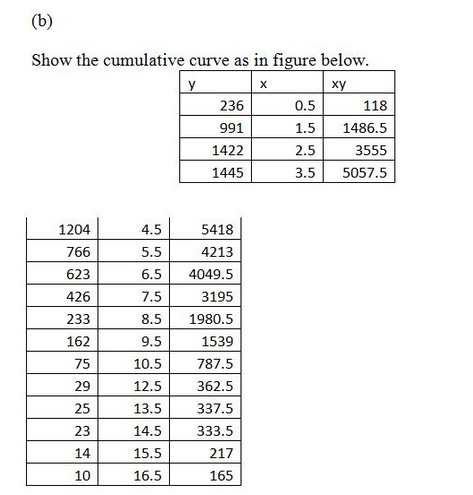
Show the cumulative curve as in figure below xy 236 991 1422 1445 0.5 1.5 1486.5 2.5 3.5 5057.5 118 3555 1204 766 623 426 233 162 75 29 25 23 14 10 4.5 5.5 5418 4213 6.5 4049.5 3195 8.5 1980.5 1539 787.5 362.5 337.5 333.5 217 165 7.5 9.5 10.5 12.5 13.5 14.5 15.5 16.5
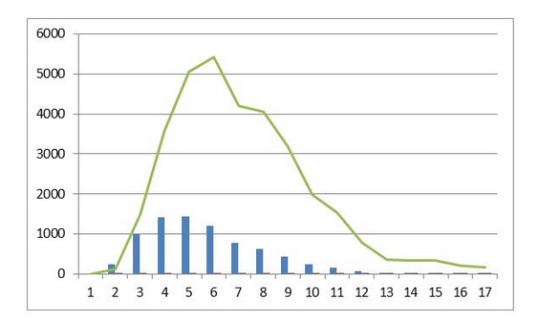
6000 5000 4000 3000 2000 1000 1 2 3 4 5 6 7 8 9 10 11 12 13 14 15 16 17
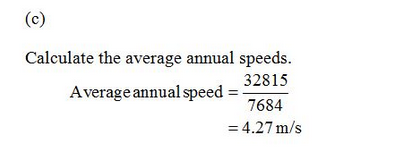
Calculate the average annual speeds. 32815 7684 -4.27 m/s Average annual speed
Know the answer?
Add Answer to:
Problem 1) At Al-Ummari in the East of Jordan the following wind speed vs. hours per year data we...
Not the answer you're looking for?
Ask your own homework help question.
Our experts will answer your question WITHIN MINUTES for Free.
Similar Homework Help Questions
ADVERTISEMENT
Need Online Homework Help?
Ask
a QuestionGet Answers For Free
Most questions answered within 3 hours.
Most questions answered within 3 hours.
ADVERTISEMENT
ADVERTISEMENT
Active Questions
-
Suppose that XX is a random variable with mean 16 and standard
deviation 5 . Also...
asked 11 minutes ago -
Calculate the number density of argon gas at a temperature of
24C and a pressure of...
asked 3 hours ago -
Alternative
Classification
How to Estimate
Probabilities from Data? ( For continuous Attributes)
And How to generate...
asked 3 hours ago -
An explosion breaks a 20.0-kg object into three parts. The
object is initially moving at a...
asked 4 hours ago -
Calculate the approximate number of residues of Rubisco, which
is involved in carbon fixation in plants,...
asked 5 hours ago -
Other decisions about scientific claims can have a much broader
impact.ENERGYarrow-10x10.png, environment, health, security - all...
asked 6 hours ago -
I need to write a research paper and work cited about this
topic: The United States...
asked 6 hours ago -
Hello! I was wondering if I could have some help?
If the vapor pressure of carvone...
asked 6 hours ago -
An economist wants to estimate the mean per capita income (in
thousands of dollars) for a...
asked 7 hours ago -
What would be the input/output characteristic of a circuit
obtained by putting two of your 2's-complementers...
asked 7 hours ago -
In Drosophila, the transition from the syncytial blastoderm
stage to the cellular blastoderm stage is a...
asked 7 hours ago -
Project management question:
Name 3 different types of resources (hint: humans are one
type)
asked 7 hours ago
ADVERTISEMENT