
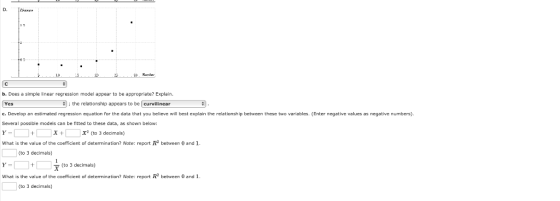
D. b. Does a simple linear regression model appear to be appropriate? Explain. ;the relationship appears to be curvilinear Yes c. Develop an estimated regression equation for the data that you believe will best explain the relationship between these two variables. (Enter negative values as negative numbers). Several possible models can be fitted to these data, as shown below x + X2 (to 3 decimals) What is the value of the coefficient of determination? Not report R between 0 and 1 (to 3 decimals) L(to 3 decimals) What is the value of the coefficient of determination? Note:report R betee and 1 (to 3 decimal)
Homework Answers
Independent variable (x): Number of facilities
Dependent variable (y): Average Distance (miles)
(a)
Following is the scatter plot of the data:

(b)
The relationship appears to be curvilinear linear .
(c)
Following is the data for regression model:
| Y | X | X^2 |
| 1.59 | 5 | 25 |
| 0.76 | 11 | 121 |
| 0.47 | 16 | 256 |
| 0.32 | 20 | 400 |
| 0.35 | 24 | 576 |
| 0.37 | 29 | 841 |
Following is the output of Quardatic model generated by excel:
| SUMMARY OUTPUT | ||||||
| Regression Statistics | ||||||
| Multiple R | 0.993511819 | |||||
| R Square | 0.987065735 | |||||
| Adjusted R Square | 0.978442891 | |||||
| Standard Error | 0.072082162 | |||||
| Observations | 6 | |||||
| ANOVA | ||||||
| df | SS | MS | F | Significance F | ||
| Regression | 2 | 1.189545819 | 0.59477291 | 114.4710243 | 0.001471 | |
| Residual | 3 | 0.015587514 | 0.005195838 | |||
| Total | 5 | 1.205133333 | ||||
| Coefficients | Standard Error | t Stat | P-value | Lower 95% | Upper 95% | |
| Intercept | 2.357073882 | 0.132304749 | 17.81548955 | 0.000385632 | 1.936021121 | 2.778126643 |
| X | -0.181111865 | 0.017340445 | -10.44447623 | 0.001873532 | -0.2362969 | -0.12592683 |
| X^2 | 0.003936144 | 0.000499813 | 7.875240205 | 0.004266066 | 0.002345517 | 0.00552677 |
The required regression model is
Y=2.357 -0.181* X+ 0.004*x^2
The R-square is: 0.987
--------------------------------------
Following is the data for regression model:
| Y | 1/X |
| 1.59 | 0.2 |
| 0.76 | 0.090909 |
| 0.47 | 0.0625 |
| 0.32 | 0.05 |
| 0.35 | 0.041667 |
| 0.37 | 0.034483 |
Following is the required regression model:
| SUMMARY OUTPUT | ||||||
| Regression Statistics | ||||||
| Multiple R | 0.992880057 | |||||
| R Square | 0.985810808 | |||||
| Adjusted R Square | 0.98226351 | |||||
| Standard Error | 0.065383231 | |||||
| Observations | 6 | |||||
| ANOVA | ||||||
| df | SS | MS | F | Significance F | ||
| Regression | 1 | 1.188033466 | 1.188033466 | 277.9047131 | 7.58599E-05 | |
| Residual | 4 | 0.017099868 | 0.004274967 | |||
| Total | 5 | 1.205133333 | ||||
| Coefficients | Standard Error | t Stat | P-value | Lower 95% | Upper 95% | |
| Intercept | 0.015703759 | 0.046151433 | 0.340265904 | 0.750774783 | -0.11243316 | 0.143840678 |
| 1/X | 7.852592163 | 0.471047915 | 16.67047429 | 7.58599E-05 | 6.544753484 | 9.160430842 |
The required regression model is
Y=0.016+7.853 *(1/x)
The value of the coefficient of determination is
The R-square is: 0.986
Add Answer to:
D. b. Does a simple linear regression model appear to be appropriate? Explain. ;the relationship ...
What does the error term in the simple linear regression model account for? What are the...
What does the error term in the simple linear regression model account for? What are the parameters of the simple linear model When all the points fall on the regression line, what is the value of the correlation coefficient? Part of an Excel output relating 15 observations of X (independent variable) and Y (dependent variable) is shown below. Provide the values for a-e shown in the table below. (See section 15.5) Summary Output ANOVA df SS MS F Significance F...
Simple Linear regression 1. A researcher uses a simple linear regression to measure the relationship between...
 Simple Linear regression
1. A researcher uses a simple linear regression to measure the relationship between the monthly salary (Salary measured in dollars) of data scientists and the number of years since being awarded a Master degree (Master Degree). A random sample of 80 observations was collected for the analysis. A researcher used the econometric model which has the following specification Salary,-β0 + β, Master-Degree, + εί, where i = 1, , 80 The (incomplete) Excel output of equation (1)...
Simple Linear regression
1. A researcher uses a simple linear regression to measure the relationship between the monthly salary (Salary measured in dollars) of data scientists and the number of years since being awarded a Master degree (Master Degree). A random sample of 80 observations was collected for the analysis. A researcher used the econometric model which has the following specification Salary,-β0 + β, Master-Degree, + εί, where i = 1, , 80 The (incomplete) Excel output of equation (1)...
2. In a typical simple linear regression model, explore the relationship between the expected value of change in the re...
 2. In a typical simple linear regression model, explore the relationship between the expected value of change in the response variable y and the value of the regressor x changed by 20 or 40 units. Describe the condition or assumption, if any, to meet for such exploration. 3. In a multiple linear regression model where x1 and x2 are two regressors. Explore the relationship between the expected value of change in the response variable y and the value of the...
Question 6 (10 marks) Finally, the researcher considers using regression analysis to establish a linear relationship...
Question 6 (10 marks) Finally, the researcher considers using regression analysis to establish a linear relationship between the two variables – hours worked per week and yearly income. a) What is the dependent variable and independent variable for this analysis? Why? (2 marks) b) Use an appropriate plot to investigate the relationship between the two variables. Display the plot. On the same plot, fit a linear trend line including the equation and the coefficient of determination R2 . (2 marks)...
Simple Linear Regression Problem QUESTION 7 A US consumer lobby wishes to develop a model to...
 Simple Linear Regression Problem
QUESTION 7 A US consumer lobby wishes to develop a model to predict gasoline usage, as measured by miles per gallon, based on the weight of the car in pounds. The Excel data file AUTO.xls (contained in a folder under the CML Quizzes tab) contains data on this for fifty recent models. Use Excel Data Analysis to estimate a linear model for the relationship, a 95% confidence interval for as opecoefice and ha residua po State...
Simple Linear Regression Problem
QUESTION 7 A US consumer lobby wishes to develop a model to predict gasoline usage, as measured by miles per gallon, based on the weight of the car in pounds. The Excel data file AUTO.xls (contained in a folder under the CML Quizzes tab) contains data on this for fifty recent models. Use Excel Data Analysis to estimate a linear model for the relationship, a 95% confidence interval for as opecoefice and ha residua po State...
Does there appear to be a relationship between the variables? A Yes, there appears to be a positi...
 Can you please explain step by step on how to do it in excel
Does there appear to be a relationship between the variables? A Yes, there appears to be a positive relationship between the variables. OB. Yes, there appears to be a negative relationship between the variables ° C There appears to be a positive relationship between the variables at low levels of a country's trade share, but a negative relationship at high levels of a country's trade share....
Can you please explain step by step on how to do it in excel
Does there appear to be a relationship between the variables? A Yes, there appears to be a positive relationship between the variables. OB. Yes, there appears to be a negative relationship between the variables ° C There appears to be a positive relationship between the variables at low levels of a country's trade share, but a negative relationship at high levels of a country's trade share....
please help! Following is a simple linear regression model: y = a + A + &...
 please help!
Following is a simple linear regression model: y = a + A + & The following results were obtained from some statistical software. R2 = 0.523 Syx (regression standard error) = 3.028 n (total observations) = 41 Significance level = 0.05 = 5% Variable Interecpt Slope of X Parameter Estimate 0.519 -0.707 Std. Err. of Parameter Est 0.132 0.239 Note: For all the calculated numbers, keep three decimals. Write the fitted model (5 points) 2. Make a prediction...
please help!
Following is a simple linear regression model: y = a + A + & The following results were obtained from some statistical software. R2 = 0.523 Syx (regression standard error) = 3.028 n (total observations) = 41 Significance level = 0.05 = 5% Variable Interecpt Slope of X Parameter Estimate 0.519 -0.707 Std. Err. of Parameter Est 0.132 0.239 Note: For all the calculated numbers, keep three decimals. Write the fitted model (5 points) 2. Make a prediction...
Help with some data science questions Q.1 The linear regression model assumes multivariate normality, no or...
Help with some data science questions Q.1 The linear regression model assumes multivariate normality, no or little multicollinearity, no auto-correlation, and homoscedasticity? Which assumption is missing from this list? (no more than 10 words) Q.2 The coefficient of correlation measures the percent change in the feature variables explained by the target variables. a) True b) False Q.3 In a linear regression model, the coefficient measures the change in Y explained by one unit-change in X. a) True b) False Q4....
A regression line can be used to determine the strength of a relationship. determine if there...
 Question 6A regression line can be used to determine the strength of a relationship. determine if there is a cause and effect relationship. predict Y for any X value. establish if a relationship is linear. Question 7 If the correlation coefficient R between two variables is ,it is expected that the slope of the regression line will be positive; positive positive; large negative; small positive; negative Question 8 If the slope of the simple regression line is .12, then the Pearson correlation coefficient r is expected to be positive negative small large
A sample containing years to maturity and yield () for corporate bonds are contained in the...
 A sample containing years to maturity and yield () for corporate
bonds are contained in the table below.
Company Ticker
Years
Yield
GE
1.00
0.767
MS
1.10
1.716
WFC
1.35
0.897
TOTAL
1.75
1.378
TOTAL
3.25
1.748
GS
3.75
3.558
MS
4.00
4.413
JPM
4.25
2.310
C
4.75
3.332
RABOBK
4.75
2.805
TOTAL
5.00
2.069
MS
5.00
4.739
AXP
5.00
2.181
MTNA
5.00
4.366
BAC
5.00
3.699
VOD
5.00
1.855
SHBASS
5.00
2.861
AIG
5.00
3.452
HCN
7.00
4.184
MS...
A sample containing years to maturity and yield () for corporate
bonds are contained in the table below.
Company Ticker
Years
Yield
GE
1.00
0.767
MS
1.10
1.716
WFC
1.35
0.897
TOTAL
1.75
1.378
TOTAL
3.25
1.748
GS
3.75
3.558
MS
4.00
4.413
JPM
4.25
2.310
C
4.75
3.332
RABOBK
4.75
2.805
TOTAL
5.00
2.069
MS
5.00
4.739
AXP
5.00
2.181
MTNA
5.00
4.366
BAC
5.00
3.699
VOD
5.00
1.855
SHBASS
5.00
2.861
AIG
5.00
3.452
HCN
7.00
4.184
MS...
 Simple Linear regression
1. A researcher uses a simple linear regression to measure the relationship between the monthly salary (Salary measured in dollars) of data scientists and the number of years since being awarded a Master degree (Master Degree). A random sample of 80 observations was collected for the analysis. A researcher used the econometric model which has the following specification Salary,-β0 + β, Master-Degree, + εί, where i = 1, , 80 The (incomplete) Excel output of equation (1)...
Simple Linear regression
1. A researcher uses a simple linear regression to measure the relationship between the monthly salary (Salary measured in dollars) of data scientists and the number of years since being awarded a Master degree (Master Degree). A random sample of 80 observations was collected for the analysis. A researcher used the econometric model which has the following specification Salary,-β0 + β, Master-Degree, + εί, where i = 1, , 80 The (incomplete) Excel output of equation (1)...
 2. In a typical simple linear regression model, explore the relationship between the expected value of change in the response variable y and the value of the regressor x changed by 20 or 40 units. Describe the condition or assumption, if any, to meet for such exploration. 3. In a multiple linear regression model where x1 and x2 are two regressors. Explore the relationship between the expected value of change in the response variable y and the value of the...
 Simple Linear Regression Problem
QUESTION 7 A US consumer lobby wishes to develop a model to predict gasoline usage, as measured by miles per gallon, based on the weight of the car in pounds. The Excel data file AUTO.xls (contained in a folder under the CML Quizzes tab) contains data on this for fifty recent models. Use Excel Data Analysis to estimate a linear model for the relationship, a 95% confidence interval for as opecoefice and ha residua po State...
Simple Linear Regression Problem
QUESTION 7 A US consumer lobby wishes to develop a model to predict gasoline usage, as measured by miles per gallon, based on the weight of the car in pounds. The Excel data file AUTO.xls (contained in a folder under the CML Quizzes tab) contains data on this for fifty recent models. Use Excel Data Analysis to estimate a linear model for the relationship, a 95% confidence interval for as opecoefice and ha residua po State...
 Can you please explain step by step on how to do it in excel
Does there appear to be a relationship between the variables? A Yes, there appears to be a positive relationship between the variables. OB. Yes, there appears to be a negative relationship between the variables ° C There appears to be a positive relationship between the variables at low levels of a country's trade share, but a negative relationship at high levels of a country's trade share....
Can you please explain step by step on how to do it in excel
Does there appear to be a relationship between the variables? A Yes, there appears to be a positive relationship between the variables. OB. Yes, there appears to be a negative relationship between the variables ° C There appears to be a positive relationship between the variables at low levels of a country's trade share, but a negative relationship at high levels of a country's trade share....
 please help!
Following is a simple linear regression model: y = a + A + & The following results were obtained from some statistical software. R2 = 0.523 Syx (regression standard error) = 3.028 n (total observations) = 41 Significance level = 0.05 = 5% Variable Interecpt Slope of X Parameter Estimate 0.519 -0.707 Std. Err. of Parameter Est 0.132 0.239 Note: For all the calculated numbers, keep three decimals. Write the fitted model (5 points) 2. Make a prediction...
please help!
Following is a simple linear regression model: y = a + A + & The following results were obtained from some statistical software. R2 = 0.523 Syx (regression standard error) = 3.028 n (total observations) = 41 Significance level = 0.05 = 5% Variable Interecpt Slope of X Parameter Estimate 0.519 -0.707 Std. Err. of Parameter Est 0.132 0.239 Note: For all the calculated numbers, keep three decimals. Write the fitted model (5 points) 2. Make a prediction...
 Question 6A regression line can be used to determine the strength of a relationship. determine if there is a cause and effect relationship. predict Y for any X value. establish if a relationship is linear. Question 7 If the correlation coefficient R between two variables is ,it is expected that the slope of the regression line will be positive; positive positive; large negative; small positive; negative Question 8 If the slope of the simple regression line is .12, then the Pearson correlation coefficient r is expected to be positive negative small large
 A sample containing years to maturity and yield () for corporate
bonds are contained in the table below.
Company Ticker
Years
Yield
GE
1.00
0.767
MS
1.10
1.716
WFC
1.35
0.897
TOTAL
1.75
1.378
TOTAL
3.25
1.748
GS
3.75
3.558
MS
4.00
4.413
JPM
4.25
2.310
C
4.75
3.332
RABOBK
4.75
2.805
TOTAL
5.00
2.069
MS
5.00
4.739
AXP
5.00
2.181
MTNA
5.00
4.366
BAC
5.00
3.699
VOD
5.00
1.855
SHBASS
5.00
2.861
AIG
5.00
3.452
HCN
7.00
4.184
MS...
A sample containing years to maturity and yield () for corporate
bonds are contained in the table below.
Company Ticker
Years
Yield
GE
1.00
0.767
MS
1.10
1.716
WFC
1.35
0.897
TOTAL
1.75
1.378
TOTAL
3.25
1.748
GS
3.75
3.558
MS
4.00
4.413
JPM
4.25
2.310
C
4.75
3.332
RABOBK
4.75
2.805
TOTAL
5.00
2.069
MS
5.00
4.739
AXP
5.00
2.181
MTNA
5.00
4.366
BAC
5.00
3.699
VOD
5.00
1.855
SHBASS
5.00
2.861
AIG
5.00
3.452
HCN
7.00
4.184
MS...
Most questions answered within 3 hours.
-
MATLAB HW 11 problem using Switch Case and Input commands
Write a script file that calculates...
asked 1 minute from now -
A college student is employed as a door-to-door newspaper
salesman. Historical data suggests that the student...
asked 13 minutes ago -
Considering gravitational time dilation, calculate the time that
passes in Earth’s surface while 1 hour passes...
asked 37 minutes ago -
Minitab Problem: Take the Lake Hume June rainfall data and find
use the processes outlined in...
asked 1 hour ago -
X Company is trying to decide whether to continue using old
equipment to make Product A...
asked 1 hour ago -
IN PYTHON ONLY !! Program 2: Re-work
program #5 (WeeklyHours) from the previous assignment such that...
asked 2 hours ago -
The average length of time between arrivals at a turnpike
toll-booth is 26 seconds. What is...
asked 3 hours ago -
(a) A piston at 6.1 atm contains a gas that occupies a volume of
3.5 L....
asked 4 hours ago -
Please answer true or false. Words
cannot be changed or added in to make it true...
asked 4 hours ago -
An empty test tube weighs 15.923 grams. Then,
MgCl2•6H2O is added into the test tube. After...
asked 5 hours ago -
Assume memory access is 10 units of time and disk access is
10000 units of time....
asked 5 hours ago -
1. Are all good samples random?
2. Magazines often report surveys giving statistics such as “63%...
asked 5 hours ago