
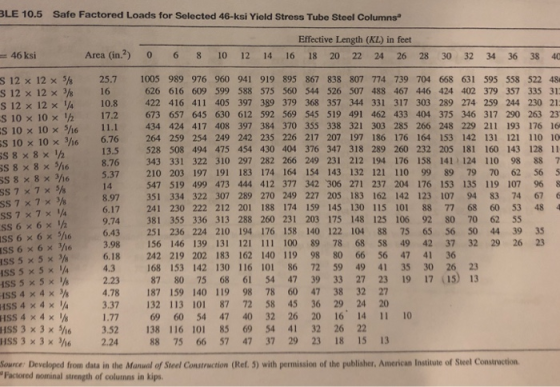
BLE 10.5 Safe Factored Loads for Selected 46-ksi Yield Stress Tube Steel Columns Effective Length (KL) in feet Area (in.2) 06 8 10 12 14 16 18 20 22 24 26 28 30 32 34 36 38 40 S 12×12× 5/s S12 × 12 × 3/s S 12x12x ¼ s 10 x 10 x 1/2 s 10 x 10 x h6 11.1 S 10 x 10 x 366.76 257 16 10.8 17.2 1005 989 976 960 941 919 895 867 838 807 774 739 704 668 631 595 558 522 48 626 616 609 599 588 575 560 544 526 507 488 467 446 424 402 379 357 335 31 422 416 411 405 397 389 379 368 357 344 331 317 303 289 274 259 244 230 21: 673 657 645 630 612 592 569 545 519 491 462 433 404 375 346 317 290 263 23 434 424 417 408 397 384 370 355 338 321 303 285 266 248 229 211 193 176 16 264 259 254 249 242 235 226 217 207 197 186 176 164 153 142 131 121 110 1o 13.5 528 508 494 475 454 430 404 376 347 318 289 260 232 205 181 160 143 128 11 8.76 343 331 322 310 297 282 266 249 231 212 194 176 158 141 124 110 98 88 7 5.37 210 203 197 191 183 174 164 154 143 132 121 110 99 89 79 70 62 56 5 547 519 499 473 444 412 377 342 306 271 237 204 176 153 135 119 107 96 S 8.97 351 334 322 307 289 270 249 227 205 183 162 142 123 107 94 83 74 67 6 6.17 241 230 222 212 201 188 174 159 145 130 115 101 88 77 68 60 53 48 4 417 9.74 381 355 336 313 288 260 231 203 175 148 125 106 92 80 70 62 55 6.43 251 236 224 210 194 176 158 140 122 104 88 75 65 56 50 44 39 35 ISS 6 × 6×3/16 6.18 242 219 202 183 162 140 119 98 80 66 56 4741 36 4.3 168 153 142 130 116 101 86 72 59 49 41 35 30 26 23 2.23 87 80 75 68 61 54 47 39 33 27 23 19 17 (15) 13 4.78 187 159 140 119 98 78 60 47 38 32 27 4 × 4 × ¼ HSS 4 x 4x HSS 3 x 3 x h63.52 138 116 101 85 69 54 41 32 26 22 HSS3x3x'İ6 2.24 88 75 66 57 47 37 29 23 18 15 13 132 113 101 87 72 58 45 36 29 24 20 69 60 54 47 40 32 26 20 16 14 11 10 HSS Source Developed from data in the Monual of Steel Construction (Ref. 5) with permission of the publisher, American Institute of Steel Construction Factored nominal strength of columns in kips
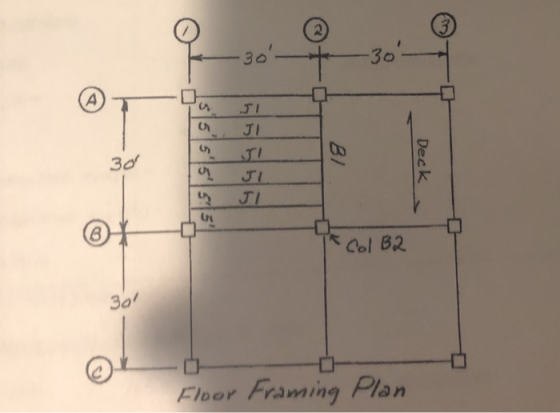
3d 0o 2 JI Col B2 宁 3o/ Floor Framing Plan
Homework Answers


Add Answer to:
Design Column B2: KL 30, Use an HSS section, Fy 46 ksi. pe 0.9 Use table 10.5 from handout Calcul...
Your IT department provided you data on patients that received ER services, their GHHS, and their recovery time. Prepare a report to share with the owners of the facility that will help you make infor...
Your IT department provided you data on patients that received ER services, their GHHS, and their recovery time. Prepare a report to share with the owners of the facility that will help you make informed decisions about how long you can expect a patients’ recovery time would be based on their GHHS. Based on your findings provide recommendations on your plan moving forward to improve the functioning of your facilities in generating revenue. Prepare a report that addresses each of...
33 On May 6, Jim Ryan borrowed $14,000 from Lane Bank at 7 % interest. Jim...
 33 On May 6, Jim Ryan borrowed $14,000 from Lane Bank at 7 % interest. Jim plans to repay the loan on March 11. Assume the loan is on ordinary interest. How much will Jim repay on March 11? (Use Days in a year table) (Round your answer to the nearest cent.) Jm repay etbook 7-1 TABLE Exact days-in-a-year calendar (excluding leap year)" Day of month 30 31 30 31 28 31 30 31 31 30 31 31 Dec Mar...
Zion, Inc. has one employee who has worked January - June of the current year. The...
 Zion, Inc. has one employee who has worked January - June of the current year. The employee is single, paid weekly, and claims three allowances on her W-2. The company is in a state that has no state income taxes. The FICA Social Security tax rate is 6.2 % on the first $118,500 of wages and the FICA Medicare tax rate is 1.45% on all wages. Zion, Inc.'s FUTA tax rate is 0.6 % on the first $7,000 of wages...
1. Forecast demand for Year 4. a. Explain what technique you utilized to forecast your demand....
 1. Forecast demand for Year 4.
a. Explain what technique you utilized to forecast your
demand.
b. Explain why you chose this technique over others.
Year 3 Year 1 Year 2 Actual Actual Actual Forecast Forecast Forecast Demand Demand Demand Week 1 52 57 63 55 66 77 Week 2 49 58 68 69 75 65 Week 3 47 50 58 65 80 74 Week 4 60 53 58 55 78 67 57 Week 5 49 57 64 76 77...
1. Forecast demand for Year 4.
a. Explain what technique you utilized to forecast your
demand.
b. Explain why you chose this technique over others.
Year 3 Year 1 Year 2 Actual Actual Actual Forecast Forecast Forecast Demand Demand Demand Week 1 52 57 63 55 66 77 Week 2 49 58 68 69 75 65 Week 3 47 50 58 65 80 74 Week 4 60 53 58 55 78 67 57 Week 5 49 57 64 76 77...
Im using SPSS to test whether the researchers’ predictions are true and to determine the proportion...
Im using SPSS to test whether the researchers’ predictions are true and to determine the proportion of cholesterol concentration that is explained by time watching TV. but I dont know what test to run. please help DATA is below Case Number 1 2 3 4 5 6 7 8 9 10 11 12 13 14 15 16 17 18 19 20 21 22 23 24 25 26 27 28 29 30 31 32 33 34 35 36 37 38 39...
data: (copy and paste in excel to view columns in alignment) Sample Repair Time (days) 1 ...
 data: (copy and paste in excel to view columns in alignment)
Sample Repair Time (days)
1 12
2 17
3 9
4 16
5 10
6 18
7 12
8 14
9 15
10 14
11 14
12 8
13 11
14 10
15 8
16 8
17 14
18 12
19 14
20 13
21 12
22 15
23 15
24 10
25 24
26 17
27 13
28 15
29 13
30 15
31 36
32 40
33 ...
data: (copy and paste in excel to view columns in alignment)
Sample Repair Time (days)
1 12
2 17
3 9
4 16
5 10
6 18
7 12
8 14
9 15
10 14
11 14
12 8
13 11
14 10
15 8
16 8
17 14
18 12
19 14
20 13
21 12
22 15
23 15
24 10
25 24
26 17
27 13
28 15
29 13
30 15
31 36
32 40
33 ...
Bubba's Burgers - Statistics Question
 Sampled StoreDessert Orders Per 1,000 TransactionsStore 1185Store 2226Store 3290Store 4226Store 5255Store 6293Store 7138Store 8203Store 9276Store 10173Store 11275Store 12199Store 13213Store 14321Store 1597Store 16152Store 17319Store 18193Store 19126Store 20215Store 21186Store 22289Store 23181Store 24196Store 25183Store 2690Store 27178Store 28103Store 29173Store 30231Store 31158Store 32202Store 33234Store 34273Store 35218Store 36247Store 37223Store 38108Store 39238Store 40143Store 41206Store 42300Store 4389Store 44202Store 45250Store 46210Store 47137Store 48215Store 49204Store 50188Store 51255Store 52196Store 53123Store 54189Store 55206Store 56146Store 57136Store 58211Store 59164Store 60246Store 61324Store 62125Store 63195Store 64173Store 65179Store 6676Store 67248Store 68199Store 69223Store 70240Store 71224Store 72215Store 73222Store 74170Store...
You have two groups of apples (data below). You want to see if there is a...
You have two groups of apples (data below). You want to see if there is a statistical differnce between the two groups. Run descriptives and a two tailed, two sample assuming equal variance t-test. Here's your data: Weight of Apples in Grams Apple ID Farm A Farm B 1 131 151 2 147 159 3 134 162 4 134 158 5 136 159 6 137 160 7 140 150 8 134 160 9 136 160 10 133 160 11 134...
Select the group of the periodic table with a condensed electron configuration of [X]ns 2n-1)d10np5. 2...
 Select the group of the periodic table with a condensed electron configuration of [X]ns 2n-1)d10np5. 2 Cayo The Mompanies, Ine. Permon required for production or MAIN-GROUP ELEMENTS Metal (main group) MAIN-GROUP Metals (ansition ELEMENTS Metals (inner transition 1A Metode (0) Normal (18) H 2A 2 1.000 123 JA 4A SA GA 7A He (13) (14) (15) (16) (17) K1003 LI Be 5 6 7 10 6.941 2012 B с N o Ne 10.81 12.01 14/01 16.00 19.00 2018 12 TRANSITION...
The data from data349.dat contains information on 78 seventh-grade students. We want to know how well each of IQ score a...
The data from data349.dat contains information on 78 seventh-grade students. We want to know how well each of IQ score and self-concept score predicts GPA using least-squares regression. We also want to know which of these explanatory variables predicts GPA better. Give numerical measures that answer these questions. (Round your answers to three decimal places.) (Regressor: IQ) R 2 (Regressor: Self-Concept) R 2 Which variable is the better predictor? IQ Self Concept obs gpa iq gender concept 1 7.94 112 ...
 33 On May 6, Jim Ryan borrowed $14,000 from Lane Bank at 7 % interest. Jim plans to repay the loan on March 11. Assume the loan is on ordinary interest. How much will Jim repay on March 11? (Use Days in a year table) (Round your answer to the nearest cent.) Jm repay etbook 7-1 TABLE Exact days-in-a-year calendar (excluding leap year)" Day of month 30 31 30 31 28 31 30 31 31 30 31 31 Dec Mar...
 Zion, Inc. has one employee who has worked January - June of the current year. The employee is single, paid weekly, and claims three allowances on her W-2. The company is in a state that has no state income taxes. The FICA Social Security tax rate is 6.2 % on the first $118,500 of wages and the FICA Medicare tax rate is 1.45% on all wages. Zion, Inc.'s FUTA tax rate is 0.6 % on the first $7,000 of wages...
 1. Forecast demand for Year 4.
a. Explain what technique you utilized to forecast your
demand.
b. Explain why you chose this technique over others.
Year 3 Year 1 Year 2 Actual Actual Actual Forecast Forecast Forecast Demand Demand Demand Week 1 52 57 63 55 66 77 Week 2 49 58 68 69 75 65 Week 3 47 50 58 65 80 74 Week 4 60 53 58 55 78 67 57 Week 5 49 57 64 76 77...
1. Forecast demand for Year 4.
a. Explain what technique you utilized to forecast your
demand.
b. Explain why you chose this technique over others.
Year 3 Year 1 Year 2 Actual Actual Actual Forecast Forecast Forecast Demand Demand Demand Week 1 52 57 63 55 66 77 Week 2 49 58 68 69 75 65 Week 3 47 50 58 65 80 74 Week 4 60 53 58 55 78 67 57 Week 5 49 57 64 76 77...
 data: (copy and paste in excel to view columns in alignment)
Sample Repair Time (days)
1 12
2 17
3 9
4 16
5 10
6 18
7 12
8 14
9 15
10 14
11 14
12 8
13 11
14 10
15 8
16 8
17 14
18 12
19 14
20 13
21 12
22 15
23 15
24 10
25 24
26 17
27 13
28 15
29 13
30 15
31 36
32 40
33 ...
data: (copy and paste in excel to view columns in alignment)
Sample Repair Time (days)
1 12
2 17
3 9
4 16
5 10
6 18
7 12
8 14
9 15
10 14
11 14
12 8
13 11
14 10
15 8
16 8
17 14
18 12
19 14
20 13
21 12
22 15
23 15
24 10
25 24
26 17
27 13
28 15
29 13
30 15
31 36
32 40
33 ...
 Select the group of the periodic table with a condensed electron configuration of [X]ns 2n-1)d10np5. 2 Cayo The Mompanies, Ine. Permon required for production or MAIN-GROUP ELEMENTS Metal (main group) MAIN-GROUP Metals (ansition ELEMENTS Metals (inner transition 1A Metode (0) Normal (18) H 2A 2 1.000 123 JA 4A SA GA 7A He (13) (14) (15) (16) (17) K1003 LI Be 5 6 7 10 6.941 2012 B с N o Ne 10.81 12.01 14/01 16.00 19.00 2018 12 TRANSITION...
Most questions answered within 3 hours.
-
(Expected rate of return and risk) Carter Inc. is evaluating a
security. Calculate the investment’s expected...
asked 29 minutes ago -
What specific indicators can point to lack of progress for
African Americans in American society?
asked 1 hour ago -
1-The Electrons in a beam are moving at 2.7×10⁸ m/s in an
electric field of 15000...
asked 1 hour ago -
A gas tank is a vertical cylinder. It has a radius of 1m, a
height of...
asked 2 hours ago -
Accent Software faces the following conditions. All of these
support Accent’s use of a market-penetration pricing...
asked 3 hours ago -
A mathematically inclined friend emails you the following
instructions: "Meet me in the cafeteria the first...
asked 3 hours ago -
A monopoly sells in two countries . The demand curves in the two
countries are p1...
asked 4 hours ago -
A .15kg rubber ball is bounced off a wall. Before hitting the
wall, the ball moves...
asked 4 hours ago -
A manufacturing company preparing to build a new plant is
considering three potential locations for it....
asked 4 hours ago -
B. If compound Y has approximately the same values of solubility
in toluene as compound X,...
asked 5 hours ago -
Oscar Inc. has inventory in Japan valued at 39,051,000 Yen one
year ago. One year ago...
asked 5 hours ago -
If Canada suffered from "fundamental disequilibrium," and its
government choose not to devalue its currency, a...
asked 5 hours ago