The relationship between "strength" and "fineness" of cotton fibers was the subject of a study th...
The relationship between "strength" and "fineness" of cotton fibers was the subject of a study that produced the following data. (Give your answers correct to two decimal places.)
| x, Strength | 75 | 78 | 74 | 69 | 80 | 82 | 80 | 86 | 70 | 88 |
| y, Fineness | 3.8 | 4 | 4.5 | 3.7 | 4.3 | 3.8 | 3.8 | 4.7 | 4.8 | 3.7 |
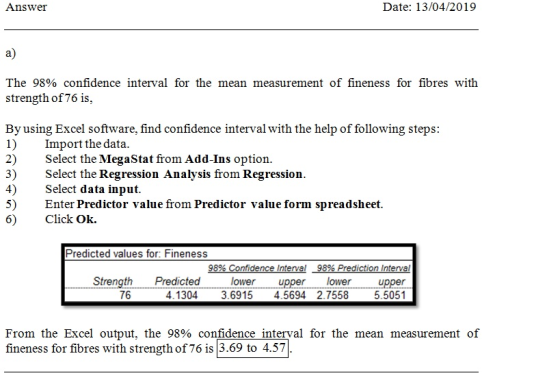
(a) Find the 98% confidence interval for the mean measurement of
fineness for fibers with a strength of 76.
Upper Limit -
Lower Limit-
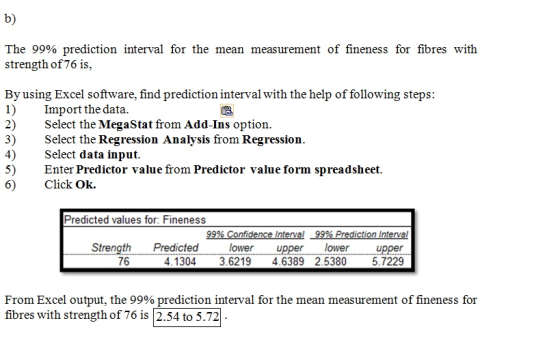
(b) Find the 99% prediction interval for an individual measurement
of fineness for fibers with a strength of 76.
Upper Limit -
Lower Limit-
Homework Answers
Add Answer to:
The relationship between "strength" and "fineness" of cotton fibers was the subject of a study th...
The relationship between "strength" and "fineness" of cotton fibers was the subject of a study that...
The relationship between "strength" and "fineness" of cotton fibers was the subject of a study that produced the following data. (Give your answers correct to two decimal places.) x, Strength 69 75 83 69 83 79 75 76 69 83 y, Fineness 3.8 4.7 4.7 4.1 3.9 4.4 4.4 4.3 4.6 4.1 (a) Draw a scatter diagram. (Do this on paper. Your instructor may ask you to turn in this work.) (b) Find the 95% confidence interval for the mean...
The relationship between "strength" and "fineness" of cotton fibers was the subject of a study that...
The relationship between "strength" and "fineness" of cotton fibers was the subject of a study that produced the following data. (Give your answers correct to two decimal places.) x, Strength 76 73 69 84 70 73 73 79 72 88 y, Fineness 4.6 4.6 4.1 4.7 3.8 4.6 4.5 4.8 4.8 3.8 (a) Draw a scatter diagram. (Do this on paper. Your instructor may ask you to turn in this work.) (b) Find the 98% confidence interval for the mean...
How do you find the difference of mean for a data set???? Here are my numbers...
How do you find the difference of mean for a data set???? Here are my numbers drinking soda (15 min after) 91 69 82 66 76 66 92 72 89 78 74 99 69 86 58 80 66 60 76 78 82 77 80 88 74 68 92 67 96 75 75 94 75 70 74 80 96 67 80 76 80 82 64 80
Consider the below matrixA, which you can copy and paste directly into Matlab.
Problem #1: Consider the below matrix A, which you can copy and paste directly into Matlab. The matrix contains 3 columns. The first column consists of Test #1 marks, the second column is Test # 2 marks, and the third column is final exam marks for a large linear algebra course. Each row represents a particular student.A = [36 45 75 81 59 73 77 73 73 65 72 78 65 55 83 73 57 78 84 31 60 83...
Use the accompanying data set on the pulse rates (in beats per minute) of males to...
Use the accompanying data set on the pulse rates (in beats per minute) of males to complete parts (a) and (b) below. LOADING... Click the icon to view the pulse rates of males. a. Find the mean and standard deviation, and verify that the pulse rates have a distribution that is roughly normal. The mean of the pulse rates is 71.871.8 beats per minute. (Round to one decimal place as needed.) The standard deviation of the pulse rates is 12.212.2...
An experiment is conducted to determine if classes offered in an online format are as effective a...
An experiment is conducted to determine if classes offered in an online format are as effective as classes offered in a traditional classroom setting. Students were randomly assigned to one of the two teaching methods. Data below. a. Test the claim that the standard deviations for the two groups are equal. What is the p-value of the test? b. Construct a 95% confidence interval on the difference in expected final exam scores between the two groups. Does the data support...
1. Forecast demand for Year 4. a. Explain what technique you utilized to forecast your demand....
 1. Forecast demand for Year 4.
a. Explain what technique you utilized to forecast your
demand.
b. Explain why you chose this technique over others.
Year 3 Year 1 Year 2 Actual Actual Actual Forecast Forecast Forecast Demand Demand Demand Week 1 52 57 63 55 66 77 Week 2 49 58 68 69 75 65 Week 3 47 50 58 65 80 74 Week 4 60 53 58 55 78 67 57 Week 5 49 57 64 76 77...
1. Forecast demand for Year 4.
a. Explain what technique you utilized to forecast your
demand.
b. Explain why you chose this technique over others.
Year 3 Year 1 Year 2 Actual Actual Actual Forecast Forecast Forecast Demand Demand Demand Week 1 52 57 63 55 66 77 Week 2 49 58 68 69 75 65 Week 3 47 50 58 65 80 74 Week 4 60 53 58 55 78 67 57 Week 5 49 57 64 76 77...
Boats (tens of thousands) Manatees 66 55 65 38 69 34 67 49 74 42 75 59 78 53 84 69 81 82 87 79 90 81 94 93 92 74 98 67 99 78 102 91 100 73 98 91 97 97 93 82 8...
 Boats (tens of
thousands) Manatees
66 55
65 38
69 34
67 49
74 42
75 59
78 53
84 69
81 82
87 79
90 81
94 93
92 74
98 67
99 78
102 91
100 73
98 91
97 97
93 82
88 89
87 80
90 71
92 68
idrresponding numbe o ms for 880.000 registered Use the accompanying paired data consisting of registered boats (tens of thousands) and manatee fatalities from boat encounters. Let x...
Boats (tens of
thousands) Manatees
66 55
65 38
69 34
67 49
74 42
75 59
78 53
84 69
81 82
87 79
90 81
94 93
92 74
98 67
99 78
102 91
100 73
98 91
97 97
93 82
88 89
87 80
90 71
92 68
idrresponding numbe o ms for 880.000 registered Use the accompanying paired data consisting of registered boats (tens of thousands) and manatee fatalities from boat encounters. Let x...
The attached data contains a sample of resting heart rates for 40 adult Americans who visited...
The attached data contains a sample of resting heart rates for 40 adult Americans who visited a local doctor’s office. Assume that this sample is representative of all adult Americans. Your goal is to visualize the data set and answer probability questions based on it. This problems has 5 parts and is worth 25 points total. Pulse 56 60 62 62 64 64 66 68 68 72 72 72 72 72 72 72 74 74 76 76 78 78 78...
Problem 8.4: Refer to Muscle Mass Problem 1.27. Second-order regression model (8.2) with independent normal error...
Problem 8.4: Refer to Muscle Mass Problem 1.27. Second-order regression model (8.2) with independent normal error terms is expected to be appropriate. A. Fit regression model (8.2). Plot the fitted regression function and the data. Does the quadratic regression function appear to be a good fit here? Find R^2. B. Test whether or not there is regression relation; use α= .05. State the alternatives, decision rule and conclusion. C. Estimate the mean muscle mass for women aged 48...
 1. Forecast demand for Year 4.
a. Explain what technique you utilized to forecast your
demand.
b. Explain why you chose this technique over others.
Year 3 Year 1 Year 2 Actual Actual Actual Forecast Forecast Forecast Demand Demand Demand Week 1 52 57 63 55 66 77 Week 2 49 58 68 69 75 65 Week 3 47 50 58 65 80 74 Week 4 60 53 58 55 78 67 57 Week 5 49 57 64 76 77...
1. Forecast demand for Year 4.
a. Explain what technique you utilized to forecast your
demand.
b. Explain why you chose this technique over others.
Year 3 Year 1 Year 2 Actual Actual Actual Forecast Forecast Forecast Demand Demand Demand Week 1 52 57 63 55 66 77 Week 2 49 58 68 69 75 65 Week 3 47 50 58 65 80 74 Week 4 60 53 58 55 78 67 57 Week 5 49 57 64 76 77...
 Boats (tens of
thousands) Manatees
66 55
65 38
69 34
67 49
74 42
75 59
78 53
84 69
81 82
87 79
90 81
94 93
92 74
98 67
99 78
102 91
100 73
98 91
97 97
93 82
88 89
87 80
90 71
92 68
idrresponding numbe o ms for 880.000 registered Use the accompanying paired data consisting of registered boats (tens of thousands) and manatee fatalities from boat encounters. Let x...
Boats (tens of
thousands) Manatees
66 55
65 38
69 34
67 49
74 42
75 59
78 53
84 69
81 82
87 79
90 81
94 93
92 74
98 67
99 78
102 91
100 73
98 91
97 97
93 82
88 89
87 80
90 71
92 68
idrresponding numbe o ms for 880.000 registered Use the accompanying paired data consisting of registered boats (tens of thousands) and manatee fatalities from boat encounters. Let x...
Most questions answered within 3 hours.
-
Do not neglect the old for the new. The existing business must
not lose priority simply...
asked 20 minutes ago -
Kylie is a single mom with two dependent children,
Tanner, age 7 and Olivia, age 11....
asked 1 hour ago -
Phosphorous + bromine = phosphorous tribromide. If 35.0 g of
bromine are reacted and 27.9 grams...
asked 3 hours ago -
Derive the long wavelength limit of the Planck energy density
distribution
asked 2 hours ago -
Calculate the pH of each of the following solutions.
0.50 M HBr
3.1×10⁻⁴ M KOH
4.2×10⁻⁵...
asked 6 hours ago -
For the year ended December 31, Depot Max’s cost of merchandise
sold was $85,600. Inventory at the...
asked 6 hours ago -
Week 10 - Professional Memo Assignment
Professional Memo Assignment
Your mission for this week, should you...
asked 6 hours ago -
Write a Python program that stores the data for each
player on the team, and it...
asked 6 hours ago -
In
the last 3 months, mike never knows when he is going to get his
allowance...
asked 7 hours ago -
Is Ca(OH)2 a Bronsted base, Lewis base, or both? Why?
asked 7 hours ago -
1A- Why don’t voters complain about U.S. tariffs on imported
sugar?
Because sugar is only a...
asked 7 hours ago -
Cash Payback Period
Primera Banco is evaluating two capital investment proposals for
a drive-up ATM kiosk,...
asked 7 hours ago