
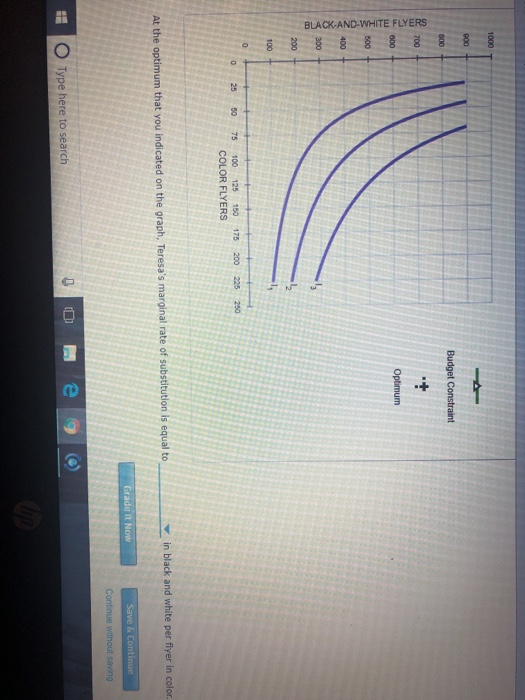
1000 Budget Constraint 600 Optimum 500 o 25 50 75 100 125 150 175 200 225 250 COLOR FLYERS in black and white per flyer in color. At the optimum that you indicated on the graph, Teresa's marginal rate of substitution is equal to Continue without saving 0 Type here to search
Homework Answers
since the utility function is unknown, we cannot determine the MRS by conventional methods. to do this problem we need to see where our budget constraint is tangent to any of the indifference curve. the point of tangancy gives of the utility maximizing bundle and thus the MRS is found out by finding the slope of IC at that bundle. thus you can solve it by drawing budget line, finding the point of tangancy and calculating slope at that point
Add Answer to:
4. Indifference curves and utility maximization Teresa is in a band and likes to advertise upcomi...
Maria enjoys eating bagels and scones. The following graph displays one of Maria's indifference curves (11),...
 Maria enjoys eating bagels and scones. The following graph displays one of Maria's indifference curves (11), which shows her preference for bagels and scones each month. SCONES -- + -- -- 8 10 14 BAGELS Complete the following table by determining Maria's marginal rate of substitution (MRS) between the two points listed in each row. (Note: Although Che MRS is technically always negative, enter a positive number in the following table since it asks for the amount of scones per...
The following graph shows a variety of possible indifference curves (labeled IC1, IC2, and IC3, respectively)...
 The following graph shows a variety of possible indifference curves (labeled IC1, IC2, and IC3, respectively) for Latasha. Each indifference curve represents a different level of happiness. RASPBERRIES (Pints per month 10 Budget Constraint Best Bundle IC3 C1 0 2 3 456 7 8 9 10 STRAWBERRIES (Pints per month) HelpClear ALl The shape of the indifference curves indicates that the goods strawberries and raspberries must be Suppose the price of strawberries is $3 per pint, the price of raspberries...
college student has two options for budget is $60. for meals: eating at the dining hall...
 college student has two options for budget is $60. for meals: eating at the dining hall for $6 per meal, or eating a Cup O Soup for $2 per meal. Her weokly food Assume that she spends equal amounts on both goods On the following graph, use the green line (tnangle indicate the initial optimum in this case. symbol) to draw the college student's budget constraint. Then use the black point (plus symbol) to 50 45 40 35+ dget Constraint...
LATTES t 10. Deriving demand from an indifference map Lucia lives in Philadelphia and enjoys drinking...
 LATTES t 10. Deriving demand from an indifference map Lucia lives in Philadelphia and enjoys drinking lattes and eating scones. The price of a latte is held constant at $4 throughout this problem. On the following graph, the purple curves (I I2) represent two of Lucia's indifference curves. The lines BC and BC2 show two budget and constraints. Points X and Y show Lucia's optimum consumption bundles subject to these budget constraints. 20 18 16 14 12 10 E LATTES...
 Maria enjoys eating bagels and scones. The following graph displays one of Maria's indifference curves (11), which shows her preference for bagels and scones each month. SCONES -- + -- -- 8 10 14 BAGELS Complete the following table by determining Maria's marginal rate of substitution (MRS) between the two points listed in each row. (Note: Although Che MRS is technically always negative, enter a positive number in the following table since it asks for the amount of scones per...
 The following graph shows a variety of possible indifference curves (labeled IC1, IC2, and IC3, respectively) for Latasha. Each indifference curve represents a different level of happiness. RASPBERRIES (Pints per month 10 Budget Constraint Best Bundle IC3 C1 0 2 3 456 7 8 9 10 STRAWBERRIES (Pints per month) HelpClear ALl The shape of the indifference curves indicates that the goods strawberries and raspberries must be Suppose the price of strawberries is $3 per pint, the price of raspberries...
 college student has two options for budget is $60. for meals: eating at the dining hall for $6 per meal, or eating a Cup O Soup for $2 per meal. Her weokly food Assume that she spends equal amounts on both goods On the following graph, use the green line (tnangle indicate the initial optimum in this case. symbol) to draw the college student's budget constraint. Then use the black point (plus symbol) to 50 45 40 35+ dget Constraint...
 LATTES t 10. Deriving demand from an indifference map Lucia lives in Philadelphia and enjoys drinking lattes and eating scones. The price of a latte is held constant at $4 throughout this problem. On the following graph, the purple curves (I I2) represent two of Lucia's indifference curves. The lines BC and BC2 show two budget and constraints. Points X and Y show Lucia's optimum consumption bundles subject to these budget constraints. 20 18 16 14 12 10 E LATTES...
Most questions answered within 3 hours.
-
A solid, uniform disk of radius 0.250 m and mass 53.7 kg rolls
down a ramp...
asked 6 minutes ago -
Given the following table of high speed internet access vs.
annual home income:
Home Income
%...
asked 31 minutes ago -
A baseball batter hits a 0.145kg baseball straight up into the
air. The baseball leaves the...
asked 1 hour ago -
An FM modulator is tested using
single-tone baseband signal with frequency of 50kHz and a sprectrum...
asked 1 hour ago -
Write the ionic equations for the first stage of salts
hydrolysis.
Anion, Cation?
Na2S
NiSO4
K2SO4...
asked 2 hours ago -
suppose there is a normally distributed population with a mean of
250 and a standard deviation...
asked 3 hours ago -
Question Three
Suppose you as project manager are using the Waterfall
development methodology on a large...
asked 4 hours ago -
Which statement is not true about welfare in Canada?
A.Benefits typically vary based on one's ability...
asked 5 hours ago -
Please help me with FLOWCHART and UML diagram for class,
thank you!
#include <iostream>
#include <fstream>...
asked 5 hours ago -
3. Describe the “logic circuit” of the Lac operon. Which
proteins are bound or not to...
asked 5 hours ago -
Ayesha’s adjusted gross income is $60,000 in 2019. She donated a
piece of artwork with a...
asked 6 hours ago -
For Dijkstra’s shortest path algorithm:
a. Give the Big-O time for Dijkstra’s shortest path algorithm
and...
asked 6 hours ago