A randomised block experiment produced the data listed below.
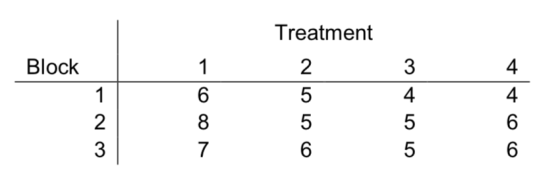
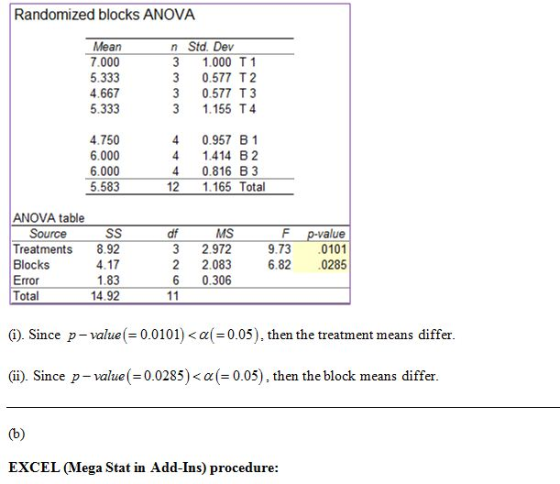
a) Conduct F-tests at the 5% significance level to find out whether
(i) the treatment means differ;
(ii) the block means differ.
-
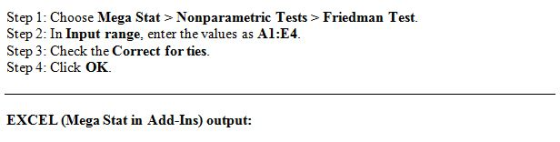
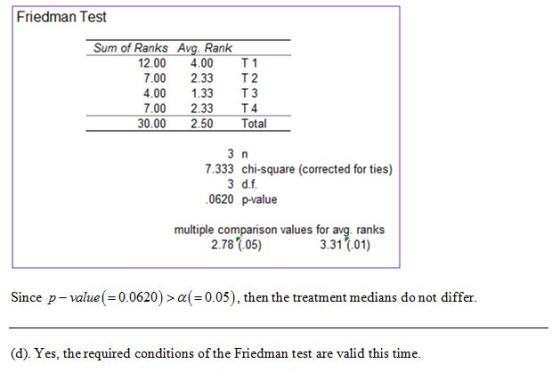
(b) Conduct a Friedman test at the 5% significance level to determine whether the treatment medians (central locations) differ.
-
(c) Are the required conditions of the Friedman test valid this time?
Homework Answers

Add Answer to:
A randomised block experiment produced the data listed below. a) Conduct F-tests at the 5% signi...
4. The following data were generated from a blocked experiment. Conduct a Friedman test to determine whether at least t...
 4. The following data were generated from a blocked experiment. Conduct a Friedman test to determine whether at least two population locations differ. locations differ, ELE Treatment Block 1 23 (a) Write down Ho and H in this hpothesis testing. (b) Find the test statistic Fr for the Friedman test (c) Make cons!usion at 5% significance level.
4. The following data were generated from a blocked experiment. Conduct a Friedman test to determine whether at least two population locations differ....
4. The following data were generated from a blocked experiment. Conduct a Friedman test to determine whether at least two population locations differ. locations differ, ELE Treatment Block 1 23 (a) Write down Ho and H in this hpothesis testing. (b) Find the test statistic Fr for the Friedman test (c) Make cons!usion at 5% significance level.
4. The following data were generated from a blocked experiment. Conduct a Friedman test to determine whether at least two population locations differ....
Topic: ANOVA Topic: ANOVA 1- An experiment was conducted using a randomized block design. The data...
Topic: ANOVA Topic: ANOVA 1- An experiment was conducted using a randomized block design. The data from the experiment are displayed in the following table. Block Treatment 1 2 3 1 2 3 5 2 8 6 7 3 7 6 5 a) Fill in the missing entries in the ANOVA table. Source df SS MS F Treatment 2 21.5555 Block 2 Error 4 Total 8 30.2222 b) Specify the null use to investigate whether a difference exists among the...
2.) The data below are from an independent-measures experiment comparing the effects of insomnia treatments. Treatment...
 2.) The data below are from an independent-measures experiment comparing the effects of insomnia treatments. Treatment 1 is a control group, Treatment 2 meditated before sleeping, and Treatment 3 received a sleeping pill. Note Pay close attention to what information you are given! Treatment1 Treatment 2 Treatment 3 6 G-36 T2 = 8 SS2 -6 T's = 24 SS-6 SS: = 6 a.Complete the ANOVA summary table below to help determine whether these data indicate any significant mean differences among...
The following two-way table gives data for a 2 × 2 factorial experiment with two observations per factor-level combination:
 The following two-way table gives data for a 2 × 2 factorial experiment with two
observations
per factor-level combination: The data are saved in the LM.TXT file. Factor B
Level 1 2
Factor A 1 29.6, 35.2 47.3, 42.1
2 12.9, 17.6 28.4, 22.7 a. Identify the treatments for this experiment. Calculate and plot the treatment means, using
the response variable as y-axis and the levels of factor B as the x-axis. Use the levels of
factor A as plotting symbols. Do...
The following two-way table gives data for a 2 × 2 factorial experiment with two
observations
per factor-level combination: The data are saved in the LM.TXT file. Factor B
Level 1 2
Factor A 1 29.6, 35.2 47.3, 42.1
2 12.9, 17.6 28.4, 22.7 a. Identify the treatments for this experiment. Calculate and plot the treatment means, using
the response variable as y-axis and the levels of factor B as the x-axis. Use the levels of
factor A as plotting symbols. Do...
plz answer from a to g A randomized block design yielded the ANOVA table to the...
 plz answer from a to g
A randomized block design yielded the ANOVA table to the right. Complete parts a through g Source Treatments Blocks Error Total df SS MS F 5 656 131.2 18.743 3 312 1040 14 857 15 105 70 23 1,073 a. How many blocks and treatments were used in the experiment? There were 6 blocks and 5 treatments used. b. How many observations were collected in the experiment? c. Specify the null and alternative hypotheses...
plz answer from a to g
A randomized block design yielded the ANOVA table to the right. Complete parts a through g Source Treatments Blocks Error Total df SS MS F 5 656 131.2 18.743 3 312 1040 14 857 15 105 70 23 1,073 a. How many blocks and treatments were used in the experiment? There were 6 blocks and 5 treatments used. b. How many observations were collected in the experiment? c. Specify the null and alternative hypotheses...
The data below are from an independent-measures experiment comparing three different treatment conditions. Conduct a one-way...
The data below are from an independent-measures experiment comparing three different treatment conditions. Conduct a one-way ANOVA on the data. Use ANOVA Handout from the One-Way ANOVA module to guide your calculations. Tell help your error checking, I will tell you that SSTotal = 74 and dfTotal = 11. Treatment 1 Treatment 2 Treatment 3 0 1 6 1 4 5 0 1 8 3 2 5 ***1.Compute SSBetween ( I am stuck on this one) 2.ss within =18 3.df...
a health psychologist tests a new intervention to determine if it can change healthy behaviors among...
 a health psychologist tests a new intervention to determine if
it can change healthy behaviors among siblings. a) test whether or
not the number of healthy behaviors differe at a 0.05 level of
significance. b) compute effect size usinf eta-squared
A health psychologist tests a new intervention to determine if it can change healthy behaviors among siblings. To conduct the this test using a matched-pairs design, t researcher gives one sibling an intervention, and the other sibling is given a...
a health psychologist tests a new intervention to determine if
it can change healthy behaviors among siblings. a) test whether or
not the number of healthy behaviors differe at a 0.05 level of
significance. b) compute effect size usinf eta-squared
A health psychologist tests a new intervention to determine if it can change healthy behaviors among siblings. To conduct the this test using a matched-pairs design, t researcher gives one sibling an intervention, and the other sibling is given a...
A randomized block design yielded the ANOVA table to the right. Complete parts a through g....
 A randomized block design yielded the ANOVA table to the right. Complete parts a through g. Source Treatments Blocks Error Total df 5 2 10 17 SS 504 276 120 900 MS 100.8 138.0 12.0 F 8.400 11.500 a. How many blocks and treatments were used in the experiment? There were There were blocks and treatments used. b. How many observations were collected in the experiment? n=0 c. Specify the null and alternative hypotheses you would use to compare the...
The options for each of part c. are: - At least one mean is different -...
 The options for each of part
c. are:
- At least one mean is different
- The means are the same.
- The standard deviations are different.
- The standard deviations are the same.
Exercise 12-15 (LO12-4) The following data are given for a two-factor ANOVA with two treatments and three blocks. Treatment Block 1 2 A 40 36 B 33 27 C 46 39 Using the 0.05 significance level conduct a test of hypothesis to determine whether the block...
The options for each of part
c. are:
- At least one mean is different
- The means are the same.
- The standard deviations are different.
- The standard deviations are the same.
Exercise 12-15 (LO12-4) The following data are given for a two-factor ANOVA with two treatments and three blocks. Treatment Block 1 2 A 40 36 B 33 27 C 46 39 Using the 0.05 significance level conduct a test of hypothesis to determine whether the block...
4 and 5 please step by step solution 4. The data below are from an independent...
 4 and 5 please step by step solution
4. The data below are from an independent measures experiment comparing three different treatment conditions with 4 people in each treatment condition. Use Tukey's HSD test to determine which of the three treatments are significantly different from each other. Use the .05 level of significance for all tests. Treatment 1 Treatment 2 Treatment 3 X 0.5 5 1. 4 Source SS df MS Between Treatments Within Treatments Total 5. df The summary...
4 and 5 please step by step solution
4. The data below are from an independent measures experiment comparing three different treatment conditions with 4 people in each treatment condition. Use Tukey's HSD test to determine which of the three treatments are significantly different from each other. Use the .05 level of significance for all tests. Treatment 1 Treatment 2 Treatment 3 X 0.5 5 1. 4 Source SS df MS Between Treatments Within Treatments Total 5. df The summary...
 4. The following data were generated from a blocked experiment. Conduct a Friedman test to determine whether at least two population locations differ. locations differ, ELE Treatment Block 1 23 (a) Write down Ho and H in this hpothesis testing. (b) Find the test statistic Fr for the Friedman test (c) Make cons!usion at 5% significance level.
4. The following data were generated from a blocked experiment. Conduct a Friedman test to determine whether at least two population locations differ....
4. The following data were generated from a blocked experiment. Conduct a Friedman test to determine whether at least two population locations differ. locations differ, ELE Treatment Block 1 23 (a) Write down Ho and H in this hpothesis testing. (b) Find the test statistic Fr for the Friedman test (c) Make cons!usion at 5% significance level.
4. The following data were generated from a blocked experiment. Conduct a Friedman test to determine whether at least two population locations differ....
 2.) The data below are from an independent-measures experiment comparing the effects of insomnia treatments. Treatment 1 is a control group, Treatment 2 meditated before sleeping, and Treatment 3 received a sleeping pill. Note Pay close attention to what information you are given! Treatment1 Treatment 2 Treatment 3 6 G-36 T2 = 8 SS2 -6 T's = 24 SS-6 SS: = 6 a.Complete the ANOVA summary table below to help determine whether these data indicate any significant mean differences among...
 plz answer from a to g
A randomized block design yielded the ANOVA table to the right. Complete parts a through g Source Treatments Blocks Error Total df SS MS F 5 656 131.2 18.743 3 312 1040 14 857 15 105 70 23 1,073 a. How many blocks and treatments were used in the experiment? There were 6 blocks and 5 treatments used. b. How many observations were collected in the experiment? c. Specify the null and alternative hypotheses...
plz answer from a to g
A randomized block design yielded the ANOVA table to the right. Complete parts a through g Source Treatments Blocks Error Total df SS MS F 5 656 131.2 18.743 3 312 1040 14 857 15 105 70 23 1,073 a. How many blocks and treatments were used in the experiment? There were 6 blocks and 5 treatments used. b. How many observations were collected in the experiment? c. Specify the null and alternative hypotheses...
 a health psychologist tests a new intervention to determine if
it can change healthy behaviors among siblings. a) test whether or
not the number of healthy behaviors differe at a 0.05 level of
significance. b) compute effect size usinf eta-squared
A health psychologist tests a new intervention to determine if it can change healthy behaviors among siblings. To conduct the this test using a matched-pairs design, t researcher gives one sibling an intervention, and the other sibling is given a...
a health psychologist tests a new intervention to determine if
it can change healthy behaviors among siblings. a) test whether or
not the number of healthy behaviors differe at a 0.05 level of
significance. b) compute effect size usinf eta-squared
A health psychologist tests a new intervention to determine if it can change healthy behaviors among siblings. To conduct the this test using a matched-pairs design, t researcher gives one sibling an intervention, and the other sibling is given a...
 A randomized block design yielded the ANOVA table to the right. Complete parts a through g. Source Treatments Blocks Error Total df 5 2 10 17 SS 504 276 120 900 MS 100.8 138.0 12.0 F 8.400 11.500 a. How many blocks and treatments were used in the experiment? There were There were blocks and treatments used. b. How many observations were collected in the experiment? n=0 c. Specify the null and alternative hypotheses you would use to compare the...
 The options for each of part
c. are:
- At least one mean is different
- The means are the same.
- The standard deviations are different.
- The standard deviations are the same.
Exercise 12-15 (LO12-4) The following data are given for a two-factor ANOVA with two treatments and three blocks. Treatment Block 1 2 A 40 36 B 33 27 C 46 39 Using the 0.05 significance level conduct a test of hypothesis to determine whether the block...
The options for each of part
c. are:
- At least one mean is different
- The means are the same.
- The standard deviations are different.
- The standard deviations are the same.
Exercise 12-15 (LO12-4) The following data are given for a two-factor ANOVA with two treatments and three blocks. Treatment Block 1 2 A 40 36 B 33 27 C 46 39 Using the 0.05 significance level conduct a test of hypothesis to determine whether the block...
 4 and 5 please step by step solution
4. The data below are from an independent measures experiment comparing three different treatment conditions with 4 people in each treatment condition. Use Tukey's HSD test to determine which of the three treatments are significantly different from each other. Use the .05 level of significance for all tests. Treatment 1 Treatment 2 Treatment 3 X 0.5 5 1. 4 Source SS df MS Between Treatments Within Treatments Total 5. df The summary...
4 and 5 please step by step solution
4. The data below are from an independent measures experiment comparing three different treatment conditions with 4 people in each treatment condition. Use Tukey's HSD test to determine which of the three treatments are significantly different from each other. Use the .05 level of significance for all tests. Treatment 1 Treatment 2 Treatment 3 X 0.5 5 1. 4 Source SS df MS Between Treatments Within Treatments Total 5. df The summary...
Most questions answered within 3 hours.
-
Question Three
Suppose you as project manager are using the Waterfall
development methodology on a large...
asked 41 minutes ago -
Which statement is not true about welfare in Canada?
A.Benefits typically vary based on one's ability...
asked 1 hour ago -
Please help me with FLOWCHART and UML diagram for class,
thank you!
#include <iostream>
#include <fstream>...
asked 1 hour ago -
3. Describe the “logic circuit” of the Lac operon. Which
proteins are bound or not to...
asked 1 hour ago -
Ayesha’s adjusted gross income is $60,000 in 2019. She donated a
piece of artwork with a...
asked 2 hours ago -
For Dijkstra’s shortest path algorithm:
a. Give the Big-O time for Dijkstra’s shortest path algorithm
and...
asked 2 hours ago -
Phosphorus violates the 'octet rule' in biological molecules,
forming more covalent bonds than expected based on...
asked 2 hours ago -
A 1.3 eV electron has a 10-4 probability of tunneling
through a 2.4 eV potential barrier....
asked 2 hours ago -
What is the one ingredient that is common to being successful
with all stakeholders?
profit
trust...
asked 2 hours ago -
Write an assembly language 32 bit program that reads in lines of
text by a .txt...
asked 2 hours ago -
what is the density ( in g/L) of hydrogen gas at 29 degrees C and a...
asked 2 hours ago -
5-6. You are considering three investment alternatives for some
spare cash: Old Reliable Corporation stock (A1),...
asked 2 hours ago