
Homework Answers
Add Answer to:
(c) Using the following table, state which points would be considered outliers using the LOF algo...
(a) Which points would you consider outliers by visual inspection? Mark these points on a printou...
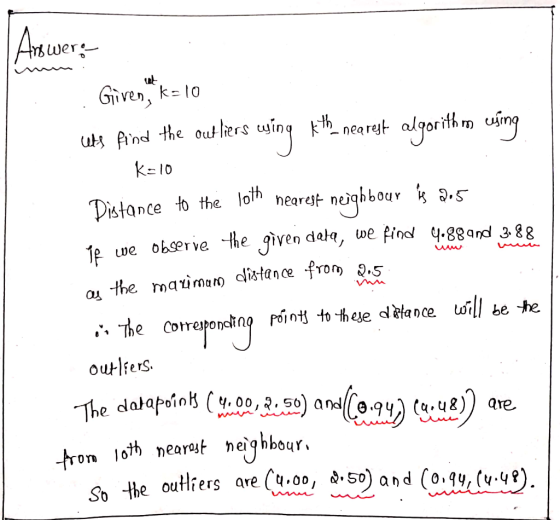
 (a) Which points would you consider outliers by visual inspection? Mark these points on a printout of the figure. (b) Using the following table, state which points would be considered outliers using the distance to kth-nearest neighbor algorithm (assume k-10). Use a threshold of 0.5 on the distance to the 10th nearest neighbor to determine outliers. xy Distance to 10th nearest neighbor 1.02 5.04 4.00 2.50 4.02 5.39 3.31 3.73 1.11 5.09 0.94 4.48 4.07 5.38 4.17 5.85 4.63 3.92...
Gain (V/V) R Setting Totals Averages Sample 1 Sample 2 Sample 3 4 ап 7.8 8.1...
 Gain (V/V) R Setting Totals Averages Sample 1 Sample 2 Sample 3 4 ап 7.8 8.1 7.9 3 5.2 6.0 4.3 = 359.3 i=1 j=1 2 4.4 6.9 3.8 1 2.0 1.7 0.8 This is actual data from one of Joe Tritschler's audio engineering experiments. Use Analysis of Variance (ANOVA) to test the null hypothesis that the treatment means are equal at the a = 0.05 level of significance. Fill in the ANOVA table. Source of Variation Sum of Squares...
1. Two manufacturing processes are being compared to try to reduce the number of defective products...
 1. Two manufacturing processes are being compared to try to reduce the number of defective products made. During 8 shifts for each process, the following results were observed: Line A Line B n 181 | 187 Based on a 5% significance level, did line B have a larger average than line A? *Use the tables I gave you in the handouts for the critical values *Use the appropriate test statistic value, NOT the p-value method *Use and show the 5...
 (a) Which points would you consider outliers by visual inspection? Mark these points on a printout of the figure. (b) Using the following table, state which points would be considered outliers using the distance to kth-nearest neighbor algorithm (assume k-10). Use a threshold of 0.5 on the distance to the 10th nearest neighbor to determine outliers. xy Distance to 10th nearest neighbor 1.02 5.04 4.00 2.50 4.02 5.39 3.31 3.73 1.11 5.09 0.94 4.48 4.07 5.38 4.17 5.85 4.63 3.92...
 Gain (V/V) R Setting Totals Averages Sample 1 Sample 2 Sample 3 4 ап 7.8 8.1 7.9 3 5.2 6.0 4.3 = 359.3 i=1 j=1 2 4.4 6.9 3.8 1 2.0 1.7 0.8 This is actual data from one of Joe Tritschler's audio engineering experiments. Use Analysis of Variance (ANOVA) to test the null hypothesis that the treatment means are equal at the a = 0.05 level of significance. Fill in the ANOVA table. Source of Variation Sum of Squares...
 Gain (V/V) R Setting Totals Averages Sample 1 Sample 2 Sample 3 4 ап 7.8 8.1 7.9 3 5.2 6.0 4.3 = 359.3 i=1 j=1 2 4.4 6.9 3.8 1 2.0 1.7 0.8 This is actual data from one of Joe Tritschler's audio engineering experiments. Use Analysis of Variance (ANOVA) to test the null hypothesis that the treatment means are equal at the a = 0.05 level of significance. Fill in the ANOVA table. Source of Variation Sum of Squares...
 1. Two manufacturing processes are being compared to try to reduce the number of defective products made. During 8 shifts for each process, the following results were observed: Line A Line B n 181 | 187 Based on a 5% significance level, did line B have a larger average than line A? *Use the tables I gave you in the handouts for the critical values *Use the appropriate test statistic value, NOT the p-value method *Use and show the 5...
Most questions answered within 3 hours.
-
Do not neglect the old for the new. The existing business must
not lose priority simply...
asked 27 minutes ago -
Kylie is a single mom with two dependent children,
Tanner, age 7 and Olivia, age 11....
asked 1 hour ago -
Phosphorous + bromine = phosphorous tribromide. If 35.0 g of
bromine are reacted and 27.9 grams...
asked 3 hours ago -
Derive the long wavelength limit of the Planck energy density
distribution
asked 3 hours ago -
Calculate the pH of each of the following solutions.
0.50 M HBr
3.1×10⁻⁴ M KOH
4.2×10⁻⁵...
asked 6 hours ago -
For the year ended December 31, Depot Max’s cost of merchandise
sold was $85,600. Inventory at the...
asked 6 hours ago -
Week 10 - Professional Memo Assignment
Professional Memo Assignment
Your mission for this week, should you...
asked 6 hours ago -
Write a Python program that stores the data for each
player on the team, and it...
asked 6 hours ago -
In
the last 3 months, mike never knows when he is going to get his
allowance...
asked 7 hours ago -
Is Ca(OH)2 a Bronsted base, Lewis base, or both? Why?
asked 7 hours ago -
1A- Why don’t voters complain about U.S. tariffs on imported
sugar?
Because sugar is only a...
asked 7 hours ago -
Cash Payback Period
Primera Banco is evaluating two capital investment proposals for
a drive-up ATM kiosk,...
asked 7 hours ago