
Homework Answers
SOLUTION
First, calculate mean of all values
Mean = 11.1538
Std dev. = 3.9337
-------------------
R-code for getting the graph (all steps mentioned)
## CREATE DATA SET FROM GIVEN QUESTION
newd3 = data.frame(sno = c(1,2,3,4,5,6,7,10,11,12,13,14,15),tot = c(24,35,27,23,19,22,31,25,22,17,26,30,21), def = c(14,16,12,12,5,14,12,6,14,5,11,16,8))
## CALCULATE MEAN AND STANDARD DEVIATION OF 'NUMBER OF DEFECTIVE FORMS '
def_mean = mean(newd3$def)
def_mean
sd = sqrt(var(newd3$def))
sd
## CREATE TARGET VALUE, UCL AND LCL - AS PER QUESTION
t_val = 8
ucl = def_mean + 1*(sd)
lcl = 0
## PLOT GRAPHS LINES AND POINTS
ggplot(newd3, aes(x = sno, y = def)) + geom_point() + geom_hline(yintercept = t_val, col = "green") + geom_hline(yintercept = ucl, col = "red") + geom_hline(yintercept = lcl, col = "red") + geom_hline(yintercept = def_mean, col = "blue", linetype = "dotdash")
-------------------
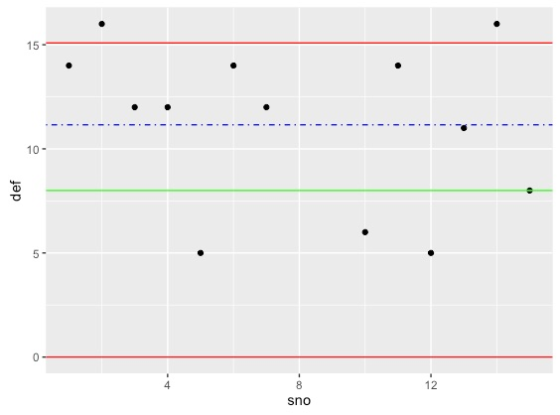
The red lines are the UCL and LCL. The green line is the target value (8) and the dot-dash blue line is the mean of number of defective forms.
This is the detailed Control chart for the variable "number of defective forms".
Add Answer to:
12) An accounts department started an improvement project to try to reduce the number of internal...
An accounts department is concerned about the number of internal purchase forms that its users completed...
An accounts department is concerned about the number of internal purchase forms that its users completed incorrectly. As a result they are monitoring the proportion of purchase forms that were not completed correctly. This was chosen, rather than measuring the actual number of defects, because any number of defects on a form required about the same effort to revise. The following table shows number of forms completed incorrectly "out of 200 forms" that is processed each day. Construct a control...
Most questions answered within 3 hours.
-
Calculate the number density of argon gas at a temperature of
24C and a pressure of...
asked 1 hour ago -
Alternative
Classification
How to Estimate
Probabilities from Data? ( For continuous Attributes)
And How to generate...
asked 1 hour ago -
An explosion breaks a 20.0-kg object into three parts. The
object is initially moving at a...
asked 2 hours ago -
Calculate the approximate number of residues of Rubisco, which
is involved in carbon fixation in plants,...
asked 3 hours ago -
Other decisions about scientific claims can have a much broader
impact.ENERGYarrow-10x10.png, environment, health, security - all...
asked 4 hours ago -
I need to write a research paper and work cited about this
topic: The United States...
asked 5 hours ago -
Hello! I was wondering if I could have some help?
If the vapor pressure of carvone...
asked 5 hours ago -
An economist wants to estimate the mean per capita income (in
thousands of dollars) for a...
asked 5 hours ago -
What would be the input/output characteristic of a circuit
obtained by putting two of your 2's-complementers...
asked 5 hours ago -
In Drosophila, the transition from the syncytial blastoderm
stage to the cellular blastoderm stage is a...
asked 6 hours ago -
Project management question:
Name 3 different types of resources (hint: humans are one
type)
asked 6 hours ago -
Consider the following reaction: C 2H 2( g) + 2H 2( g) C 2H 6(
g)...
asked 6 hours ago