Find the following formulas: Inferences for mu1 - mu2 for normal populations (or large sample siz...
Find the following formulas:
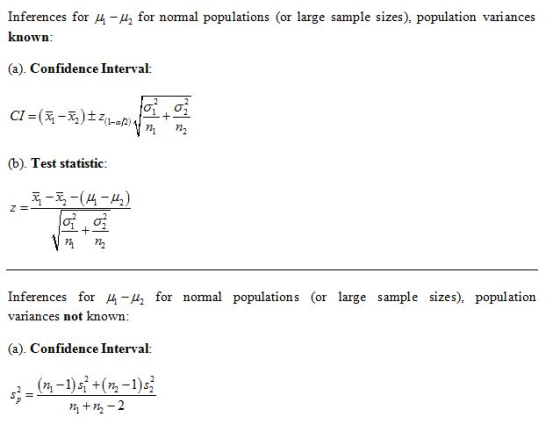
Inferences for mu1 - mu2 for normal populations (or large sample sizes), population variances known:
a)confidence interval
b)test statistic
Inferences for mu1 - mu2 for normal populations (or large sample sizes), population variances not known:
a)confidence interval
b)test statistic
Inferences for mu1 - mu2 for normal populations (or large sample sizes), from paired data:
a)confidence interval
b)test statistic
Inferences for p1-p2 for large sample sizes:
a)confidence interval
b)test statistic
Homework Answers


Add Answer to:
Find the following formulas: Inferences for mu1 - mu2 for normal populations (or large sample siz...
Independent random samples were selected from two quantitative populations, with sample sizes, means, and standard deviations...
Independent random samples were selected from two quantitative populations, with sample sizes, means, and standard deviations given below. n1= 55, n2= 65, xbar1= 35.5, xbar2= 31.4, s1= 5.7, s2= 3.3 1.) Construct a 95% confidence interval for the difference in the population means (mu1- mu2). (Round your answers to two decimal places) 2.) Find a point estimate for the fifference in the population means. 3.) Calculate a margin of error. (Round your answer to two decimal places)
(Exercise 11.1(Algorithmic)) Consider the following results for independent samples taken from two populations Sample 1 1...
 (Exercise 11.1(Algorithmic)) Consider the following results for independent samples taken from two populations Sample 1 1 400 P1 0.45 Sample 2 300 p2 0.34 a. What id the point estimate of the difference between the two population proportions (to 2 decimals)i b Develop a 90% confidence interval for the difference between the two population proportions to 4 decimals to C. Develop a 95% confidence interval for the difference between the two population proportions (to 4 decimals). to Consider the hypothesis...
Consider the following results for independent samples taken from two populations. Sample 1 Sample 2 ni...
 Consider the following results for independent samples taken from two populations. Sample 1 Sample 2 ni = 400 n2= 300 P1= 0.44 P2= 0.36 a. What is the point estimate of the difference between the two population proportions (to 2 decimals)? b. Develop a 90% confidence interval for the difference between the two population proportions (to 4 decimals). Use z-table. to c. Develop a 95% confidence interval for the difference between the two population proportions (to 4 decimals). Use z-table....
If random samples of the given sizes are drawn from populations with the given proportions, find...
 If random samples of the given sizes are drawn from populations with the given proportions, find the mean and standard error of the distribution of differences in sample proportions, fi - P2. ni = 210 from P1 = 0.7 and n2 = 240 from p2 = 0.8 Round your answers to three decimal places, if necessary. mean = standard error = i Use the normal distribution to find a confidence interval for a difference in proportions P, – pa given...
Two different simple random samples are drawn from two different populations. The first sample consists of...
 Two different simple random samples are drawn from two different populations. The first sample consists of 40 people with 20 having a common attribute. The second sam ple consists of 2200 people with 1570 of them having the same common attribute. Compare the results from a hypothesis test of p1 = p2 (with a 0.05 significance level) and a 95% confidence interval estimate of p1-p2 What are the null and alternative hypotheses for the hypothesis test? A. Ho : p1...
Independent random samples selected from two normal populations produced the sample means and standard deviations shown...
 Independent random samples selected from two normal populations produced the sample means and standard deviations shown to the right. a. Assuming equal variances, conduct the test Ho ??-?2):0 against Ha : (??-?2)#0 using ?:010. b. Find and interpret the 90% confidence interval for ( 1- 2)- Sample 1 Sample 2 n1 18 n2 13 x1-5.2 x27.7 s1 3.7 s2 4.3 a. Find the test statistic. The test statistic is (Round to two decimal places as needed.)
From two normal population assumed to have the same variance, independent random samples of sizes 15...
From two normal population assumed to have the same variance, independent random samples of sizes 15 and 19 were drawn. The first sample (n1=15) yielded mean and standard deviation 111.6 and 9.5 respectively, while the second sample (n2=19) gave mean and standard deviation 100.9 and 11.5 respectively. Suppose Ho: mu1 = mu2 Ha: mu1 > mu2 (alpha level = 0.05) (i) Write the rule for rejecting Ho in terms of T-scores. (ii) Compute the T statistic, a p-value for the...
Independent random samples selected from two normal populations produced the sample means and standard deviations shown...
 Independent random samples selected from two normal populations produced the sample means and standard deviations shown to the right. a. Assuming equal variances, conduct the test Ho (H1-H2) = 0 against Hy: (H1-H2) #0 using a = 0.10. b. Find and interpret the 90% confidence interval for (H1-H2) Sample 1 Sample 2 ny - 18 ng - 11 X2 7.8 X = 5.6 Sy = 3.1 82 4.7 a. Find the test statistic, The test statistic is (Round to two...
Consider the following results for independent samples taken from two populations. Sample 1 Sample 2 n1...
Consider the following results for independent samples taken from two populations. Sample 1 Sample 2 n1 = 500 n2 = 200 p1 = 0.47 p2 = 0.33 a. What is the point estimate of the difference between the two population proportions (to 2 decimals)? b. Develop a 90% confidence interval for the difference between the two population proportions (to 4 decimals). to c. Develop a 95% confidence interval for the difference between the two population proportions (to 4 decimals). to
 (Exercise 11.1(Algorithmic)) Consider the following results for independent samples taken from two populations Sample 1 1 400 P1 0.45 Sample 2 300 p2 0.34 a. What id the point estimate of the difference between the two population proportions (to 2 decimals)i b Develop a 90% confidence interval for the difference between the two population proportions to 4 decimals to C. Develop a 95% confidence interval for the difference between the two population proportions (to 4 decimals). to Consider the hypothesis...
 Consider the following results for independent samples taken from two populations. Sample 1 Sample 2 ni = 400 n2= 300 P1= 0.44 P2= 0.36 a. What is the point estimate of the difference between the two population proportions (to 2 decimals)? b. Develop a 90% confidence interval for the difference between the two population proportions (to 4 decimals). Use z-table. to c. Develop a 95% confidence interval for the difference between the two population proportions (to 4 decimals). Use z-table....
 If random samples of the given sizes are drawn from populations with the given proportions, find the mean and standard error of the distribution of differences in sample proportions, fi - P2. ni = 210 from P1 = 0.7 and n2 = 240 from p2 = 0.8 Round your answers to three decimal places, if necessary. mean = standard error = i Use the normal distribution to find a confidence interval for a difference in proportions P, – pa given...
 Two different simple random samples are drawn from two different populations. The first sample consists of 40 people with 20 having a common attribute. The second sam ple consists of 2200 people with 1570 of them having the same common attribute. Compare the results from a hypothesis test of p1 = p2 (with a 0.05 significance level) and a 95% confidence interval estimate of p1-p2 What are the null and alternative hypotheses for the hypothesis test? A. Ho : p1...
 Independent random samples selected from two normal populations produced the sample means and standard deviations shown to the right. a. Assuming equal variances, conduct the test Ho ??-?2):0 against Ha : (??-?2)#0 using ?:010. b. Find and interpret the 90% confidence interval for ( 1- 2)- Sample 1 Sample 2 n1 18 n2 13 x1-5.2 x27.7 s1 3.7 s2 4.3 a. Find the test statistic. The test statistic is (Round to two decimal places as needed.)
 Independent random samples selected from two normal populations produced the sample means and standard deviations shown to the right. a. Assuming equal variances, conduct the test Ho (H1-H2) = 0 against Hy: (H1-H2) #0 using a = 0.10. b. Find and interpret the 90% confidence interval for (H1-H2) Sample 1 Sample 2 ny - 18 ng - 11 X2 7.8 X = 5.6 Sy = 3.1 82 4.7 a. Find the test statistic, The test statistic is (Round to two...
Most questions answered within 3 hours.
-
You are attempting to calculate a firm’s free cash flow to
equity. You know the following...
asked 47 minutes ago -
the following reaction occurs in a balloon containing
N2O2 gas
N2O4(g)=2NO2(g)
will the volume of the...
asked 1 hour ago -
answer the questions throughout this program
public class Day implements Comparable {
Private Boolean atWork;...
asked 1 hour ago -
This is C++ code for parking fee management program
#include <iostream>
#include <iomanip>
using namespace std;...
asked 1 hour ago -
The free energy change for the following reaction at 25 °C, when
[Sn2+] = 1.17 M...
asked 3 hours ago -
An MNE is this kind of industry when competition in one country
is essentially independent of...
asked 4 hours ago -
. For this set of questions, determine what
proportion of a normal distribution is located betweeneach...
asked 5 hours ago -
A college student is employed as a door-to-door newspaper
salesman. Historical data suggests that the student...
asked 6 hours ago -
MATLAB HW 11 problem using Switch Case and Input commands
Write a script file that calculates...
asked 6 hours ago -
Considering gravitational time dilation, calculate the time that
passes in Earth’s surface while 1 hour passes...
asked 6 hours ago -
Minitab Problem: Take the Lake Hume June rainfall data and find
use the processes outlined in...
asked 7 hours ago -
X Company is trying to decide whether to continue using old
equipment to make Product A...
asked 7 hours ago