

Check my wo Total liabilities and stockholders' equity $202,350 The average number of common stock shares outstanding during 2018 was 860 shares. Net income for the year was $15,000 Required Compute each of the following: (Round your answers to 2 decimal places.) ck a. Current ratio b. Earnings per share c. Quick (acid-test) ratic d. Return on investment e. Return on equity . Dobt to equilty ratio 3.77 int S 17.44 per share 2.92 9.14%
Homework Answers
Add Answer to:
Check my Following is the balance sheet of Franklin Company for 2018 FRANKLIN COMPANY lance sheet...
Following is the balance sheet of Finch Company for 2018: FINCH COMPANY Balance sheet Assets Cash...
 Following is the balance sheet of Finch Company for 2018: FINCH COMPANY Balance sheet Assets Cash $ 15,100 8,020 13,160 11,450 173,000 (12,600) $208,130 Marketable securities Accounts receivable Inventory Property and equipment Accumulated depreciation Total assets Liabilities and Stockholders' Equity Accounts payable Current notes payable Mortgage payable Bonds payable Common stock Retained earnings Total liabilities and stockholders' equity 8,930 3, 440 5,000 21,960 113,600 55,200 $208,130 The average number of common stock shares outstanding during 2018 was 860 shares. Net...
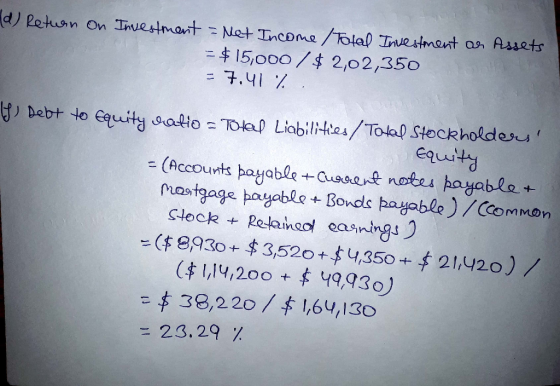
Can you check my work? Following is the balance sheet of Fanning Company for 2018: FANNING...
 Can you check my work?
Following is the balance sheet of Fanning Company for 2018: FANNING COMPANY Balance sheet Assets Cash Marketable securities Accounts receivable Inventory Property and equipment Accumulated depreciation Total assets Liabilities and Stockholders' Equity Accounts payable Current notes payable Mortgage payable Bonds payable Common stock Retained earnings Total liabilities and stockholders' equity $ 15,450 7,740 13,220 10,550 169,000 (12,400) $203,560 $ 8,120 3,888 4,550 21,900 113,200 51,910 $203,560 The average number of common stock shares outstanding during...
Can you check my work?
Following is the balance sheet of Fanning Company for 2018: FANNING COMPANY Balance sheet Assets Cash Marketable securities Accounts receivable Inventory Property and equipment Accumulated depreciation Total assets Liabilities and Stockholders' Equity Accounts payable Current notes payable Mortgage payable Bonds payable Common stock Retained earnings Total liabilities and stockholders' equity $ 15,450 7,740 13,220 10,550 169,000 (12,400) $203,560 $ 8,120 3,888 4,550 21,900 113,200 51,910 $203,560 The average number of common stock shares outstanding during...
Following is the balance sheet of Finch Company for 2018: FINCH COMPANY Balance sheet Assets Cash...
 Following is the balance sheet of Finch Company for 2018: FINCH COMPANY Balance sheet Assets Cash Marketable securities Accounts receivable Inventory Property and equipment Accumulated depreciation Total assets Liabilities and Stockholders' Equity Accounts payable Current notes payable Mortgage payable Bonds payable Common stock Retained earnings Total liabilities and stockholders' equity $ 14,550 7,900 12,800 11,200 167,500 (12,900) $ 201,050 8.690 3,000 4,300 21.360 113,700 50,000 $ 201,050 The average number of common stock shares outstanding during 2018 was 860 shares....
6 Following is the balance sheet of Thornton Company for 2018 $ 15,050 12,560 Assets Cash...
 6 Following is the balance sheet of Thornton Company for 2018 $ 15,050 12,560 Assets Cash Marketable securities Accounts receivable! Inventory Property and equipment Accumulated depreciation Total assets Liabilities and Stockholders' Equity Accounts payable Current notes payable Mortgage payable Bonds payable Common stack Retained earnings Total liabilities and stockholders equity 167,500 012,680 5201, 780 58,18€ 31240 The average number of common stock shares outstanding during 2018 was 860 shares. Net income for the year was $14.700. Required Compute each of...
Following is the balance sheet of Finch Company for 2018: FINCH COMPANY Balance sheet Assets Cash...
 Following is the balance sheet of Finch Company for 2018: FINCH COMPANY Balance sheet Assets Cash Marketable securities Accounts receivable Inventory Property and equipment Accumulated depreciation Total assets Liabilities and Stockholders' Equity Accounts payable Current notes payable Mortgage payable Bonds payable Common stock Retained earnings Total liabilities and stockholders' equity $ 15,250 8,220 13,340 11,500 166,000 (12,600) $ 201,710 $ 8,660 3,120 4,150 21,600 113,500 50,680 $ 201, 710 The average number of common stock shares outstanding during 2018 was...
Following is the balance sheet of Solomon Company for 2018: SOLOMON COMPANY Balance sheet Assets Cash...
 Following is the balance sheet of Solomon Company for 2018: SOLOMON COMPANY Balance sheet Assets Cash Marketable securities Accounts receivable Inventory Property and equipment Accumulated depreciation Total assets Liabilities and Stockholders' Equity Accounts payable Current notes payable Mortgage payable Bonds payable Common stock Retained earnings Total liabilities and stockholders' equity $ 14,750 7,620 13,160 10,750 165,500 (13,000) $198, 780 $ 8,390 3,240 4,200 21,300 113,300 48,350 $198,780 The average number of common stock shares outstanding during 2018 was 880 shares....
Following is the balance sheet of Solomon Company for 2018: SOLOMON COMPANY Balance sheet Assets Cash Marketable securi...
 Following is the balance sheet of Solomon Company for 2018: SOLOMON COMPANY Balance sheet Assets Cash Marketable securities Accounts receivable Inventory Property and equipment Accumulated depreciation Total assets Liabilities and Stockholders' Equity Accounts payable Current notes payable Mortgage payable Bonds payable Common stock Retained earnings Total liabilities and stockholders' equity $ 14,750 7,620 13,160 10,750 165,500 (13,000) $198, 780 $ 8,390 3,240 4,200 21,300 113,300 48,350 $198,780 The average number of common stock shares outstanding during 2018 was 880 shares....
Following is the balance sheet of Gibson Company for 2018: GIBSON COMPANY Balance sheet Assets Cash Marketable secu...
 Following is the balance sheet of Gibson Company for 2018: GIBSON COMPANY Balance sheet Assets Cash Marketable securities Accounts receivable Inventory Property and equipment Accumulated depreciation $. 14,850 7,580 12,920 11,450 168,500 (12,000) $203,300 Total assets Liabilities and Stockholders Equity Accounts payable Current notes payable Mortgage payable Bonds payable 8,180 3,240 4,600 21,780 114,800 50,700 $203,300 Common stock Retained earnings Total 1iabilities and stockholders' equity The average number of common stock shares outstanding during 2018 was 890 shares. Net income...
Financial statements for Franklin Company follow. FRANKLIN COMPANY Balance Sheets As of December 31 2019 2018...
Financial statements for Franklin Company follow. FRANKLIN COMPANY Balance Sheets As of December 31 2019 2018 Assets Current assets Cash $ 19,500 $ 15,500 Marketable securities 20,700 6,700 Accounts receivable (net) 48,000 40,000 Inventories 133,000 141,000 Prepaid items 27,000 12,000 Total current assets 248,200 215,200 Investments 22,000 15,000 Plant (net) 290,000 275,000 Land 33,000 28,000 Total assets $ 593,200 $ 533,200 Liabilities and Stockholders’ Equity Liabilities Current liabilities Notes payable $ 31,200 $ 18,200 Accounts payable 133,800 120,000 Salaries payable...
Financial statements for Franklin Company follow. FRANKLIN COMPANY Balance Sheets As of December 31 2019 2018...
 Financial statements for Franklin Company follow. FRANKLIN COMPANY Balance Sheets As of December 31 2019 2018 $ 19,500 28,780 48,00 133,000 27,000 248,200 22,eee 290, eee 33,000 $593,200 $ 15,5ee 6,700 40,000 141,600 12,000 215,280 15,00 275,000 28,eee $533,280 Assets Current assets Cash Marketable securities Accounts receivable (net) Inventories Prepaid itens Total current assets Investments Plant (net) Land Total assets Liabilities and Stockholders' Equity Liabilities Current liabilities Notes payable Accounts payable Salaries payable Total current liabilities Noncurrent liabilities Bonds payable...
 Following is the balance sheet of Finch Company for 2018: FINCH COMPANY Balance sheet Assets Cash $ 15,100 8,020 13,160 11,450 173,000 (12,600) $208,130 Marketable securities Accounts receivable Inventory Property and equipment Accumulated depreciation Total assets Liabilities and Stockholders' Equity Accounts payable Current notes payable Mortgage payable Bonds payable Common stock Retained earnings Total liabilities and stockholders' equity 8,930 3, 440 5,000 21,960 113,600 55,200 $208,130 The average number of common stock shares outstanding during 2018 was 860 shares. Net...
 Can you check my work?
Following is the balance sheet of Fanning Company for 2018: FANNING COMPANY Balance sheet Assets Cash Marketable securities Accounts receivable Inventory Property and equipment Accumulated depreciation Total assets Liabilities and Stockholders' Equity Accounts payable Current notes payable Mortgage payable Bonds payable Common stock Retained earnings Total liabilities and stockholders' equity $ 15,450 7,740 13,220 10,550 169,000 (12,400) $203,560 $ 8,120 3,888 4,550 21,900 113,200 51,910 $203,560 The average number of common stock shares outstanding during...
Can you check my work?
Following is the balance sheet of Fanning Company for 2018: FANNING COMPANY Balance sheet Assets Cash Marketable securities Accounts receivable Inventory Property and equipment Accumulated depreciation Total assets Liabilities and Stockholders' Equity Accounts payable Current notes payable Mortgage payable Bonds payable Common stock Retained earnings Total liabilities and stockholders' equity $ 15,450 7,740 13,220 10,550 169,000 (12,400) $203,560 $ 8,120 3,888 4,550 21,900 113,200 51,910 $203,560 The average number of common stock shares outstanding during...
 Following is the balance sheet of Finch Company for 2018: FINCH COMPANY Balance sheet Assets Cash Marketable securities Accounts receivable Inventory Property and equipment Accumulated depreciation Total assets Liabilities and Stockholders' Equity Accounts payable Current notes payable Mortgage payable Bonds payable Common stock Retained earnings Total liabilities and stockholders' equity $ 14,550 7,900 12,800 11,200 167,500 (12,900) $ 201,050 8.690 3,000 4,300 21.360 113,700 50,000 $ 201,050 The average number of common stock shares outstanding during 2018 was 860 shares....
 6 Following is the balance sheet of Thornton Company for 2018 $ 15,050 12,560 Assets Cash Marketable securities Accounts receivable! Inventory Property and equipment Accumulated depreciation Total assets Liabilities and Stockholders' Equity Accounts payable Current notes payable Mortgage payable Bonds payable Common stack Retained earnings Total liabilities and stockholders equity 167,500 012,680 5201, 780 58,18€ 31240 The average number of common stock shares outstanding during 2018 was 860 shares. Net income for the year was $14.700. Required Compute each of...
 Following is the balance sheet of Finch Company for 2018: FINCH COMPANY Balance sheet Assets Cash Marketable securities Accounts receivable Inventory Property and equipment Accumulated depreciation Total assets Liabilities and Stockholders' Equity Accounts payable Current notes payable Mortgage payable Bonds payable Common stock Retained earnings Total liabilities and stockholders' equity $ 15,250 8,220 13,340 11,500 166,000 (12,600) $ 201,710 $ 8,660 3,120 4,150 21,600 113,500 50,680 $ 201, 710 The average number of common stock shares outstanding during 2018 was...
 Following is the balance sheet of Solomon Company for 2018: SOLOMON COMPANY Balance sheet Assets Cash Marketable securities Accounts receivable Inventory Property and equipment Accumulated depreciation Total assets Liabilities and Stockholders' Equity Accounts payable Current notes payable Mortgage payable Bonds payable Common stock Retained earnings Total liabilities and stockholders' equity $ 14,750 7,620 13,160 10,750 165,500 (13,000) $198, 780 $ 8,390 3,240 4,200 21,300 113,300 48,350 $198,780 The average number of common stock shares outstanding during 2018 was 880 shares....
 Following is the balance sheet of Solomon Company for 2018: SOLOMON COMPANY Balance sheet Assets Cash Marketable securities Accounts receivable Inventory Property and equipment Accumulated depreciation Total assets Liabilities and Stockholders' Equity Accounts payable Current notes payable Mortgage payable Bonds payable Common stock Retained earnings Total liabilities and stockholders' equity $ 14,750 7,620 13,160 10,750 165,500 (13,000) $198, 780 $ 8,390 3,240 4,200 21,300 113,300 48,350 $198,780 The average number of common stock shares outstanding during 2018 was 880 shares....
 Following is the balance sheet of Gibson Company for 2018: GIBSON COMPANY Balance sheet Assets Cash Marketable securities Accounts receivable Inventory Property and equipment Accumulated depreciation $. 14,850 7,580 12,920 11,450 168,500 (12,000) $203,300 Total assets Liabilities and Stockholders Equity Accounts payable Current notes payable Mortgage payable Bonds payable 8,180 3,240 4,600 21,780 114,800 50,700 $203,300 Common stock Retained earnings Total 1iabilities and stockholders' equity The average number of common stock shares outstanding during 2018 was 890 shares. Net income...
 Financial statements for Franklin Company follow. FRANKLIN COMPANY Balance Sheets As of December 31 2019 2018 $ 19,500 28,780 48,00 133,000 27,000 248,200 22,eee 290, eee 33,000 $593,200 $ 15,5ee 6,700 40,000 141,600 12,000 215,280 15,00 275,000 28,eee $533,280 Assets Current assets Cash Marketable securities Accounts receivable (net) Inventories Prepaid itens Total current assets Investments Plant (net) Land Total assets Liabilities and Stockholders' Equity Liabilities Current liabilities Notes payable Accounts payable Salaries payable Total current liabilities Noncurrent liabilities Bonds payable...
Most questions answered within 3 hours.
-
The free energy change for the following reaction at 25 °C, when
[Sn2+] = 1.17 M...
asked 37 minutes ago -
An MNE is this kind of industry when competition in one country
is essentially independent of...
asked 2 hours ago -
. For this set of questions, determine what
proportion of a normal distribution is located betweeneach...
asked 2 hours ago -
A college student is employed as a door-to-door newspaper
salesman. Historical data suggests that the student...
asked 3 hours ago -
MATLAB HW 11 problem using Switch Case and Input commands
Write a script file that calculates...
asked 3 hours ago -
Considering gravitational time dilation, calculate the time that
passes in Earth’s surface while 1 hour passes...
asked 4 hours ago -
Minitab Problem: Take the Lake Hume June rainfall data and find
use the processes outlined in...
asked 4 hours ago -
X Company is trying to decide whether to continue using old
equipment to make Product A...
asked 4 hours ago -
IN PYTHON ONLY !! Program 2: Re-work
program #5 (WeeklyHours) from the previous assignment such that...
asked 5 hours ago -
The average length of time between arrivals at a turnpike
toll-booth is 26 seconds. What is...
asked 7 hours ago -
(a) A piston at 6.1 atm contains a gas that occupies a volume of
3.5 L....
asked 8 hours ago -
Please answer true or false. Words
cannot be changed or added in to make it true...
asked 8 hours ago