Question
please use MATlab and answer in 15 minutes
![.il 39%)[13:43 PM VIVA Di Answer 1 of1 %Straight line, Y-MX + C X1 -0.2:0.6.2; Y1 [60 350 700 900] P1- polyfit(X1, Y1,1); YP](http://img.homeworklib.com/images/92884d83-1498-4a6c-aedd-975278f5b707.png?x-oss-process=image/resize,w_560)
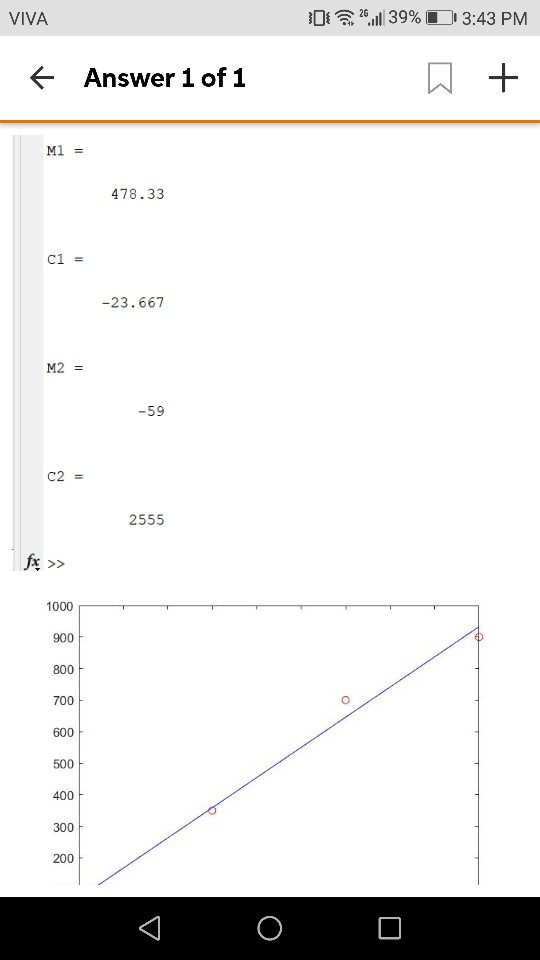
".il 39%)[13:43 PM VIVA Di Answer 1 of1 %Straight line, Y-MX + C X1 -0.2:0.6.2; Y1 [60 350 700 900] P1- polyfit(X1, Y1,1); YP1 polyval(P1, X1); M1 P1 (1) C1 P1(2) plot(X1, Y1 , 'ro', X1, YPI , 'b-'); X2-6:9; Y2 2180 2160 2110 2000]; P2 polyfit(X2, Y2,1); YP2 - polyval(P2, X2); M2-P2(1) C2 P2(2) lgure plot(X2, Y2, 'ms', X2, YP2, 'k-'); Output: Command Window 478.33 c1 -23.667
D 2611139% 13:43 PM VIVA 冂+ Answer 1 of 1 478.33 -23.667 M2 -59 C2 = 2555 1000 900 800 700 600 500 400 300 200
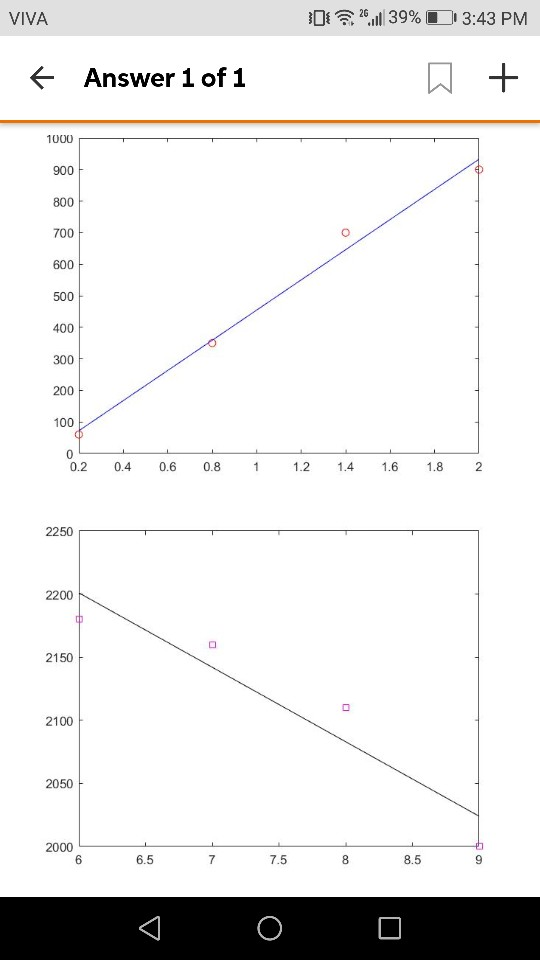
".il 39%)[13:43 PM VIVA Di 冂+ Answer 1 of1 1000 900 800 700 600 500 400 300 200 100 0.2 0.4 0.6 0.8 1.2 1.4 1.6 1.82 2250 2200 2150 2100 2050 2000 6.5 8.5 7.5
Homework Answers
Answer #1
Code:
clc
clear
%Straight line, Y = MX + C
X = linspace(0, 10, 4);
Y1 = [60 350 700 900];
P1 = polyfit(X, Y1, 1);
YP1 = polyval(P1, X);
M1 = P1(1)
C1 = P1(2)
plot(X, Y1, 'ro', X, YP1, 'b-');
Y2 = [2180 2160 2110 2000];
P2 = polyfit(X, Y2, 1);
YP2 = polyval(P2, X);
M2 = P2(1)
C2 = P2(2)
hold on
plot(X, Y2, 'ms', X, YP2, 'k-');
legend('data1', 'striaght line 1', 'data2', 'striaght line 2')
figure
XQ = 0:0.01:25;
Ys1 = interp1(X,Y1,XQ,'linear','extrap');
Ys2 = interp1(X,Y2,XQ,'linear','extrap');
plot(XQ, Ys1, XQ, Ys2);
Output:
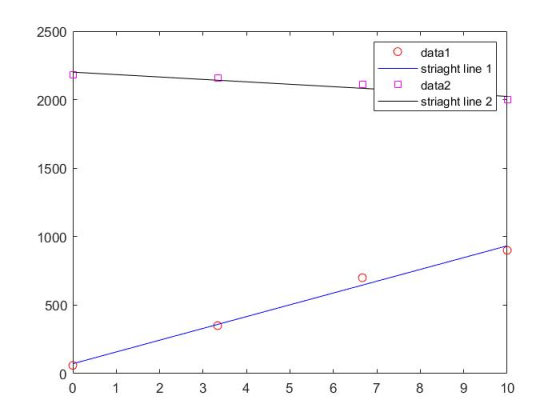
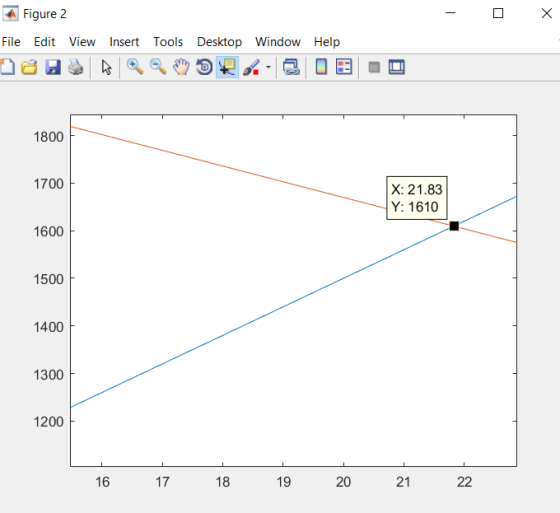
AT X = 21.83 approx values are same
2500 O data1 striaght line 1 □ data2 2000 striaght line 2 1500 1000 500 0 0 123 4 5 67 8 9 10
Figure 2 File Edit View Insert Tools Desktop Window Help 1800 X: 21.83 Y: 1610 1700 1600 1500 1400 1300 1200 21 20 19 18 17 16
Know the answer?
Add Answer to:
And Data 2 and the two fitted lines over the range o 3.3 Plot on the same groph Data 3.4 Find the...
Not the answer you're looking for?
Ask your own homework help question.
Our experts will answer your question WITHIN MINUTES for Free.
Similar Homework Help Questions
ADVERTISEMENT
Need Online Homework Help?
Ask
a QuestionGet Answers For Free
Most questions answered within 3 hours.
Most questions answered within 3 hours.
ADVERTISEMENT
ADVERTISEMENT
Active Questions
-
For this exercise, round all regression parameters to three
decimal places.
One of the two tables...
asked 16 minutes ago -
What is the 5% level of significance for mean = 3.60, standard
deviation = 0.94, and...
asked 20 minutes ago -
Prior to beginning work on this discussion, please read the
article by Hayley Peterson, 15 Companies...
asked 49 minutes ago -
Which pair of aqueous solutions, when mixed, will form a
precipitate?
A) NaNO3 and AgC2H3O2
B)...
asked 1 hour ago -
1-Write an algorithm to get two numbers from the user (as
inputs) and calculate the sum...
asked 4 hours ago -
Define white-collar crime. What is the difference between
offender and offense-based definitions of white-collar crime? What...
asked 5 hours ago -
Consider a reaction which is 1st order with respect to A and 1st
order with respect...
asked 5 hours ago -
c++
The length of the hypotenuse of a right-angled triangle is the
square root of the...
asked 5 hours ago -
When a metal rod is heated, not only its resistance but also its
length and cross‐sectional...
asked 5 hours ago -
write a c++ program that computes the L^1 - Norm of a given
vector (L^1 norm...
asked 5 hours ago -
A manufacturer of banana chips would like to know whether its
bag filling machine works correctly...
asked 5 hours ago -
Complete the chapter case, "Turnover Analysis".
Chapter Case
Turnover Analysis
You recently completed your company’s new...
asked 5 hours ago
ADVERTISEMENT