 can you please answer question
2, thanks!
can you please answer question
2, thanks!
Homework Answers
Add Answer to:
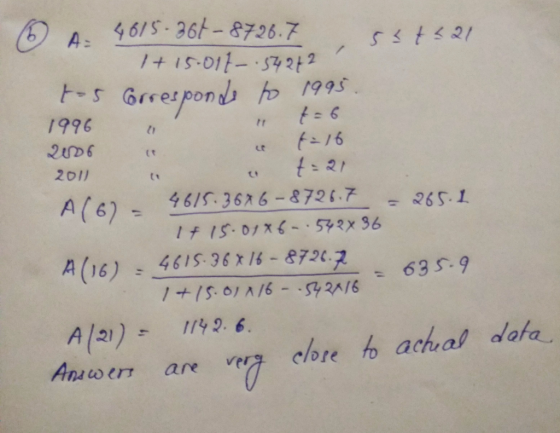
Project: Alternative-Fueled Vehicles The table shows the numbers (in thousands) of alternative-fu...
Project: Alternative-Fueled Vehicles D: Find the limit of the function as t approaches infinity. E: Interpret your answer from part (d) in the context of the problem. Does your answer make sense? Exp...
 Project: Alternative-Fueled Vehicles
D: Find the limit of the function as t approaches infinity.
E: Interpret your answer from part (d) in the context of the
problem. Does your answer make sense? Explain your reasoning.
1995 1996 1997 1998 1999 2000 2001 2002 2003 2004 2005 2006 2007 2008 2009 2010 2011 246.9 265.0 280.2 295.0 322.3 394.7 425.5 471.1 534.0 565.5 592.1 634.6 695.8 775.7 826.3 938.6 1191.8 Spreadsheet at LarsonAppliedCalculus.com (a) Use a graphing utility to plot the...
Project: Alternative-Fueled Vehicles
D: Find the limit of the function as t approaches infinity.
E: Interpret your answer from part (d) in the context of the
problem. Does your answer make sense? Explain your reasoning.
1995 1996 1997 1998 1999 2000 2001 2002 2003 2004 2005 2006 2007 2008 2009 2010 2011 246.9 265.0 280.2 295.0 322.3 394.7 425.5 471.1 534.0 565.5 592.1 634.6 695.8 775.7 826.3 938.6 1191.8 Spreadsheet at LarsonAppliedCalculus.com (a) Use a graphing utility to plot the...
Using the Consumer Price Index (CPI) detailed in the table below, Year CPI CPI Year 2003...
 Using the Consumer Price Index (CPI) detailed in the table below, Year CPI CPI Year 2003 1989 1990 1991 1992 1993 1994 1995 124.0 130.7 136.2 140.3 144.5 148.2 152.4 156.9 160.5 163.0 2004 2005 2006 2007 2008 2009 2010 184.0 188.9 195.3 201.6 207.3 215.3 214.5 218.1 224.9 229.6 233.0 236.7 237.0 240.0 1996 1997 1998 1999 2000 2011 2012 2013 2014 166.6 172.2 177.1 179.7 2001 2002 2015 2016 Instructions: Enter your responses rounded to one decimal place...
Propose at least two different hypotheses as to why the wolf population numbers in Table 1...
 Propose at least two different hypotheses as to why the wolf
population numbers in Table 1 dropped slightly from 2003-2004 and
then seemed to drop significantly from 2007-2011
Table 1-Number of wolves and number of packs at the end of each year* 199519961997 1998 1999 200020012002200320042005 119 132 148 174 118 51 86 112 118 21 # Wolves # Packs 8 10 13-14 2006 20072008 2009 20102011 136 124 96 97 98 # Wolves # Packs 1995-1999 data represents Greater...
Propose at least two different hypotheses as to why the wolf
population numbers in Table 1 dropped slightly from 2003-2004 and
then seemed to drop significantly from 2007-2011
Table 1-Number of wolves and number of packs at the end of each year* 199519961997 1998 1999 200020012002200320042005 119 132 148 174 118 51 86 112 118 21 # Wolves # Packs 8 10 13-14 2006 20072008 2009 20102011 136 124 96 97 98 # Wolves # Packs 1995-1999 data represents Greater...
The following table shows the winning times in minutes) for men and women in the New...
 The following table shows the winning times in minutes) for men and women in the New York City Marathon between 1984 and 2014. Assuming that performances in the Big Apple resemble performances elsewhere, we can think of these data as a sample of performance in marathon competitions. Create a 90% confidence interval for the mean difference in winning times for male and female marathon competitors. The 90% confidence interval for the mean difference in winning times (Women - Men) is...
Please help me with these 3 questions with a picture of your graphing calculator. Thank you!!! 1) Use your graphing calculator to solve the system of equations below. Set your window to-3...
 Please help me with these 3 questions with a picture
of your graphing calculator. Thank you!!!
1) Use your graphing calculator to solve the system of equations below. Set your window to-3 Sx$3 and 3 sys 3. Use the intersect feature to calculate the intersection of the two lines. Paste your graph below, making sure the intersection point is clearly labeled. 1-2に7iiii 2) Use your graphing calculator to graph the system of inequalities below. (Hint: You can take care of...
Please help me with these 3 questions with a picture
of your graphing calculator. Thank you!!!
1) Use your graphing calculator to solve the system of equations below. Set your window to-3 Sx$3 and 3 sys 3. Use the intersect feature to calculate the intersection of the two lines. Paste your graph below, making sure the intersection point is clearly labeled. 1-2に7iiii 2) Use your graphing calculator to graph the system of inequalities below. (Hint: You can take care of...
1. The Bicycle Helmet Safety Institute website includes a report on the number of bicycle fatalities...
 1. The Bicycle Helmet Safety Institute website includes a report on the number of bicycle fatalities per year in the U.S. The table below shows the counts for the years 1994 201.2 Year Bicycle Fatalities 1994 802 1995 833 1996 765 1997 814 1998 760 1999 754 2000 693 2001 732 2002 665 2003 629 Year Bicycle Fatalities 2004 727 2005 784 2006 769 2007 699 2008 716 2009 628 2010 616 2011 675 2012 726 a) Is Year a...
The chart to the right shows a country's annual egg production. Model the data in the...
 The chart to the right shows a country's annual egg production. Model the data in the chart with a linear function, using the points (1995,51.7) and (1999,60.5). Let x represent the year, where x = 0 represents 1995, x 1 represents 1996, and so on, and let y represent the egg production (in billions). Predict egg production in 2001 Egg production in billions) Year 1995 51.7 1996 52.6 1997 54.5 4000 The linear model for the data is (Type your...
Problem 1 The yearly streamflow record of a stream and the corresponding average annual precipi- tation...
Problem 1 The yearly streamflow record of a stream and the corresponding average annual precipi- tation data from the basin are listed below. Assuming that these data have already been tested for consistency, determine the antecedent precipitation index that contributes to the runoff. Year: 1989 1990 1991 1992 1993 1994 1995 1996 Streamflow (m3/s) 1.00 1.25 0.50 0.25 3.0 1.26 0.90 2.45 Precipitation (mm) 600 740 500 450 870 640 770 730 Year: 1997 1998 1999 2000 2001 2002 2003...
Consider the following Data: Year Tea (L per person) Coffee (L per person) 1994 42.4 95.85...
Consider the following Data: Year Tea (L per person) Coffee (L per person) 1994 42.4 95.85 1995 42.12 97.28 1996 47.61 87.62 1997 60.86 92.04 1998 55.58 99.21 1999 50.61 95.63 2000 49.89 97.42 2001 56.77 93.93 2002 62.53 95.67 2003 68.31 99.25 2004 69.88 101.31 2005 72.99 101.68 2006 71.36 104.02 2007 90.78 106.09 2008 74.7 105.8 2009 67.15 102.15 2010 67.03 101.15 2011 87.83 104.05 2012 93.4 102.7 2013 78.9 105.28 2014 111.32 106.3 2015 98.39 104.96 2016...
Because the Florida manatee population is threatened, the Florida Maatee Sanctuary Act of 1978 was enacted...
 Because the Florida manatee population is threatened, the Florida Maatee Sanctuary Act of 1978 was enacted to protect the species. Scientists interested in the relationship between the number of manatee deaths and time collected the data shown in the table. Manatee Deaths 174 163 146 192 201 416 242 232 269 272 325 305 380 276 396 416 Manatee Deaths Year 1974 1975 1976 1977 1978 1979 1980 1981 1982 1983 1984 1985 1986 1987 1988 1989 1990 Year 1991...
 Project: Alternative-Fueled Vehicles
D: Find the limit of the function as t approaches infinity.
E: Interpret your answer from part (d) in the context of the
problem. Does your answer make sense? Explain your reasoning.
1995 1996 1997 1998 1999 2000 2001 2002 2003 2004 2005 2006 2007 2008 2009 2010 2011 246.9 265.0 280.2 295.0 322.3 394.7 425.5 471.1 534.0 565.5 592.1 634.6 695.8 775.7 826.3 938.6 1191.8 Spreadsheet at LarsonAppliedCalculus.com (a) Use a graphing utility to plot the...
Project: Alternative-Fueled Vehicles
D: Find the limit of the function as t approaches infinity.
E: Interpret your answer from part (d) in the context of the
problem. Does your answer make sense? Explain your reasoning.
1995 1996 1997 1998 1999 2000 2001 2002 2003 2004 2005 2006 2007 2008 2009 2010 2011 246.9 265.0 280.2 295.0 322.3 394.7 425.5 471.1 534.0 565.5 592.1 634.6 695.8 775.7 826.3 938.6 1191.8 Spreadsheet at LarsonAppliedCalculus.com (a) Use a graphing utility to plot the...
 Using the Consumer Price Index (CPI) detailed in the table below, Year CPI CPI Year 2003 1989 1990 1991 1992 1993 1994 1995 124.0 130.7 136.2 140.3 144.5 148.2 152.4 156.9 160.5 163.0 2004 2005 2006 2007 2008 2009 2010 184.0 188.9 195.3 201.6 207.3 215.3 214.5 218.1 224.9 229.6 233.0 236.7 237.0 240.0 1996 1997 1998 1999 2000 2011 2012 2013 2014 166.6 172.2 177.1 179.7 2001 2002 2015 2016 Instructions: Enter your responses rounded to one decimal place...
 Propose at least two different hypotheses as to why the wolf
population numbers in Table 1 dropped slightly from 2003-2004 and
then seemed to drop significantly from 2007-2011
Table 1-Number of wolves and number of packs at the end of each year* 199519961997 1998 1999 200020012002200320042005 119 132 148 174 118 51 86 112 118 21 # Wolves # Packs 8 10 13-14 2006 20072008 2009 20102011 136 124 96 97 98 # Wolves # Packs 1995-1999 data represents Greater...
Propose at least two different hypotheses as to why the wolf
population numbers in Table 1 dropped slightly from 2003-2004 and
then seemed to drop significantly from 2007-2011
Table 1-Number of wolves and number of packs at the end of each year* 199519961997 1998 1999 200020012002200320042005 119 132 148 174 118 51 86 112 118 21 # Wolves # Packs 8 10 13-14 2006 20072008 2009 20102011 136 124 96 97 98 # Wolves # Packs 1995-1999 data represents Greater...
 The following table shows the winning times in minutes) for men and women in the New York City Marathon between 1984 and 2014. Assuming that performances in the Big Apple resemble performances elsewhere, we can think of these data as a sample of performance in marathon competitions. Create a 90% confidence interval for the mean difference in winning times for male and female marathon competitors. The 90% confidence interval for the mean difference in winning times (Women - Men) is...
 Please help me with these 3 questions with a picture
of your graphing calculator. Thank you!!!
1) Use your graphing calculator to solve the system of equations below. Set your window to-3 Sx$3 and 3 sys 3. Use the intersect feature to calculate the intersection of the two lines. Paste your graph below, making sure the intersection point is clearly labeled. 1-2に7iiii 2) Use your graphing calculator to graph the system of inequalities below. (Hint: You can take care of...
Please help me with these 3 questions with a picture
of your graphing calculator. Thank you!!!
1) Use your graphing calculator to solve the system of equations below. Set your window to-3 Sx$3 and 3 sys 3. Use the intersect feature to calculate the intersection of the two lines. Paste your graph below, making sure the intersection point is clearly labeled. 1-2に7iiii 2) Use your graphing calculator to graph the system of inequalities below. (Hint: You can take care of...
 1. The Bicycle Helmet Safety Institute website includes a report on the number of bicycle fatalities per year in the U.S. The table below shows the counts for the years 1994 201.2 Year Bicycle Fatalities 1994 802 1995 833 1996 765 1997 814 1998 760 1999 754 2000 693 2001 732 2002 665 2003 629 Year Bicycle Fatalities 2004 727 2005 784 2006 769 2007 699 2008 716 2009 628 2010 616 2011 675 2012 726 a) Is Year a...
 The chart to the right shows a country's annual egg production. Model the data in the chart with a linear function, using the points (1995,51.7) and (1999,60.5). Let x represent the year, where x = 0 represents 1995, x 1 represents 1996, and so on, and let y represent the egg production (in billions). Predict egg production in 2001 Egg production in billions) Year 1995 51.7 1996 52.6 1997 54.5 4000 The linear model for the data is (Type your...
 Because the Florida manatee population is threatened, the Florida Maatee Sanctuary Act of 1978 was enacted to protect the species. Scientists interested in the relationship between the number of manatee deaths and time collected the data shown in the table. Manatee Deaths 174 163 146 192 201 416 242 232 269 272 325 305 380 276 396 416 Manatee Deaths Year 1974 1975 1976 1977 1978 1979 1980 1981 1982 1983 1984 1985 1986 1987 1988 1989 1990 Year 1991...
Most questions answered within 3 hours.
-
A solid, uniform disk of radius 0.250 m and mass 53.7 kg rolls
down a ramp...
asked 1 hour ago -
Given the following table of high speed internet access vs.
annual home income:
Home Income
%...
asked 1 hour ago -
A baseball batter hits a 0.145kg baseball straight up into the
air. The baseball leaves the...
asked 2 hours ago -
An FM modulator is tested using
single-tone baseband signal with frequency of 50kHz and a sprectrum...
asked 2 hours ago -
Write the ionic equations for the first stage of salts
hydrolysis.
Anion, Cation?
Na2S
NiSO4
K2SO4...
asked 3 hours ago -
suppose there is a normally distributed population with a mean of
250 and a standard deviation...
asked 4 hours ago -
Question Three
Suppose you as project manager are using the Waterfall
development methodology on a large...
asked 5 hours ago -
Which statement is not true about welfare in Canada?
A.Benefits typically vary based on one's ability...
asked 6 hours ago -
Please help me with FLOWCHART and UML diagram for class,
thank you!
#include <iostream>
#include <fstream>...
asked 6 hours ago -
3. Describe the “logic circuit” of the Lac operon. Which
proteins are bound or not to...
asked 6 hours ago -
Ayesha’s adjusted gross income is $60,000 in 2019. She donated a
piece of artwork with a...
asked 7 hours ago -
For Dijkstra’s shortest path algorithm:
a. Give the Big-O time for Dijkstra’s shortest path algorithm
and...
asked 7 hours ago