
Homework Answers
solution:
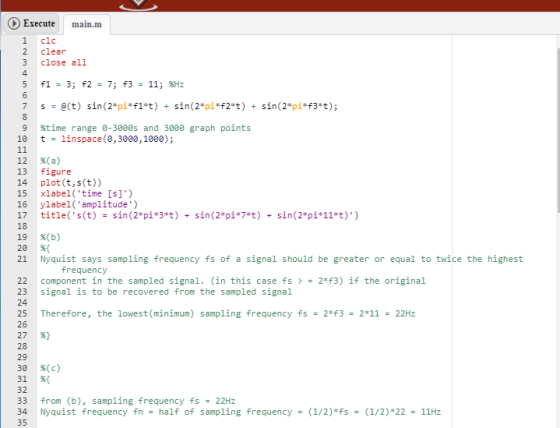
 output
screen shot:
output
screen shot:
![time [s] 1 * 1000 200 400 600 800](http://img.homeworklib.com/images/70502d4e-e5d5-42db-9f61-5241e944dc52.png?x-oss-process=image/resize,w_560)
 sample
program:
sample
program:
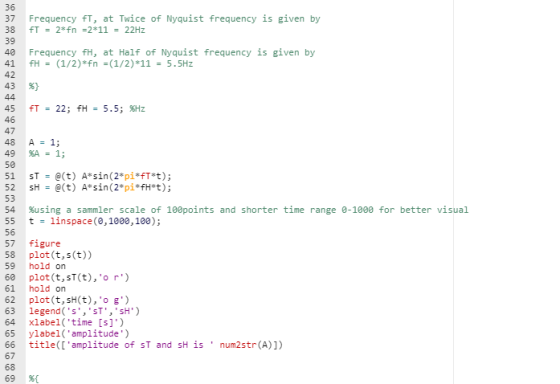
clc
clear
close all
f1 = 3; f2 = 7; f3 = 11; %Hz
s = @(t) sin(2*pi*f1*t) + sin(2*pi*f2*t) + sin(2*pi*f3*t);
%time range 0-3000s and 3000 graph points
t = linspace(0,3000,1000);
%(a)
figure
plot(t,s(t))
xlabel('time [s]')
ylabel('amplitude')
title('s(t) = sin(2*pi*3*t) + sin(2*pi*7*t) +
sin(2*pi*11*t)')
%(b)
%{
Nyquist says sampling frequency fs of a signal should be greater or
equal to twice the highest frequency
component in the sampled signal. (in this case fs > = 2*f3) if
the original
signal is to be recovered from the sampled signal
Therefore, the lowest(minimum) sampling frequency fs = 2*f3 = 2*11 = 22Hz
%}
%(c)
%{
from (b), sampling frequency fs = 22Hz
Nyquist frequency fn = half of sampling frequency = (1/2)*fs =
(1/2)*22 = 11Hz
Frequency fT, at Twice of Nyquist frequency is given
by
fT = 2*fn =2*11 = 22Hz
Frequency fH, at Half of Nyquist frequency is given
by
fH = (1/2)*fn =(1/2)*11 = 5.5Hz
%}
fT = 22; fH = 5.5; %Hz
A = 1;
%A = 1;
sT = @(t) A*sin(2*pi*fT*t);
sH = @(t) A*sin(2*pi*fH*t);
%using a sammler scale of 100points and shorter time
range 0-1000 for better visual
t = linspace(0,1000,100);
figure
plot(t,s(t))
hold on
plot(t,sT(t),'o r')
hold on
plot(t,sH(t),'o g')
legend('s','sT','sH')
xlabel('time [s]')
ylabel('amplitude')
title(['amplitude of sT and sH is ' num2str(A)])
%{
oversampling and undersampling
sT - Over-sampling
sH - Under-sampling
%}
%{
sampling a signal below the nyquist frequency causes aliasing
where
higher frequency components masquerade as though they are lower
frequency components
which causes distortion and makes it impossible to
re-construct/recover the original signal from the
sampled signal
%}
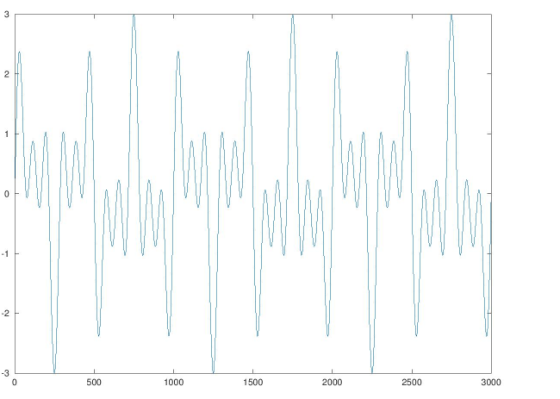
sample output:![s(t) sin(2*pi*3*t) sin(2*pi*7*t) sin (2*pi* 11*t) 3 0 -2 1500 2500 500 1000 2000 3000 time [s]](http://img.homeworklib.com/images/29fba821-83da-45f6-9c5f-d218fb930a9a.png?x-oss-process=image/resize,w_560)
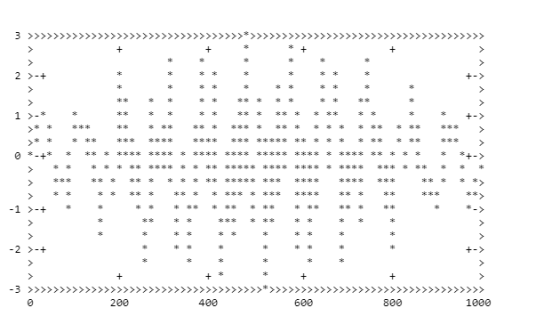
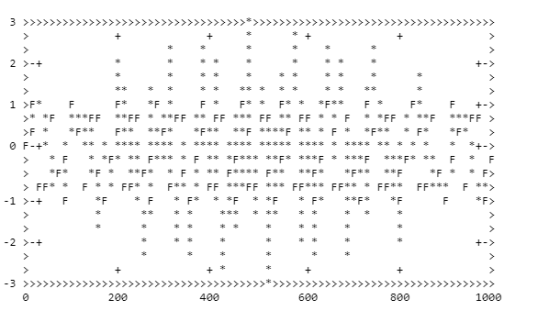
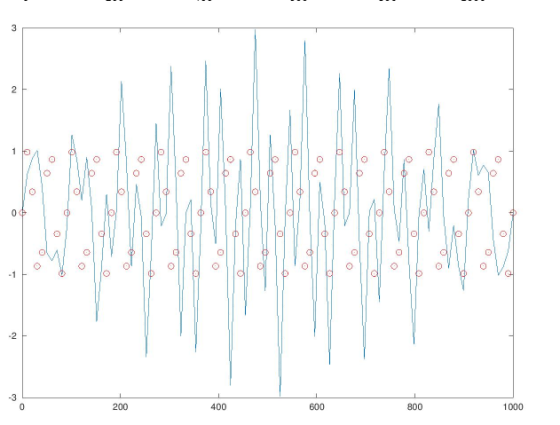
![amplitude of sT and sH is 1 3 O ST O SH 0 -2 0 100 200 300 400 500 600 700 800 900 1000 time [s]](http://img.homeworklib.com/images/b8ac3c8c-ac81-4473-a28e-87c35d988d71.png?x-oss-process=image/resize,w_560)
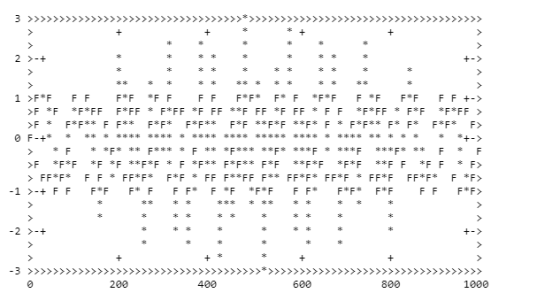
![amplitude of sT and sH is 3 O ST 0 -3 0 100 200 300 400 500 600 700 800 900 1000 time [s]](http://img.homeworklib.com/images/3955ab2a-58cc-4470-bd9e-104c5f09abe6.png?x-oss-process=image/resize,w_560)
Add Answer to:
3. For this problem, we consider a signal made of the sum of three simultaneously present sinusoi...
Ints) A continuous time signal is given below: x(t) = 10 + 3 sin (20t + 3) + 5 cos(40π) This is s...
 ints) A continuous time signal is given below: x(t) = 10 + 3 sin (20t + 3) + 5 cos(40π) This is sampled at t = 0.01 n to get a the discrete-time signal x[n], which is then applied to an ideal DAC to obtain a reconstructed continuous time signal y(t). a. i. Determine x[n] and graph its samples, using Matlab, along with the signal x(t) in one plot, plot a few cycles of x(t). ii. Determine the reconstructed signal,...
PROBLEM 2 150 pts.] A signal is consist of three sine functions: the first one, ,...
 PROBLEM 2 150 pts.] A signal is consist of three sine functions: the first one, , has a wave frequency of 50 Hz, the second one, 2, has 100 Hz, and the last one, r3, has 200 Hz. However, each function has different amplitude: the amplitude of the first signal component x! is 10 cm, the amplitude of the second signal component xi s 5 cm; and the amplitude of the last signal component t3 is 1 cm. As a...
10. Find the Fourier transform of a continuous-time signal x(t) = 10e Su(t). Plot the magnitude...
 10. Find the Fourier transform of a continuous-time signal x(t) = 10e Su(t). Plot the magnitude spectrum and the phase spectrum. If the signal is going to be sampled, what should be the minimum sampling frequency so that the aliasing error is less than 0.1 % of the maximum original magnitude at half the sampling frequency. 11. A signal x(t) = 5cos(2nt + 1/6) is sampled at every 0.2 seconds. Find the sequence obtained over the interval 0 st 3...
5.1-7 Consider a bandlimited signal g1(C) whose Fourier transform is (a) If g1(t) is uniformly sa...
 5.1-7 Consider a bandlimited signal g1(C) whose Fourier transform is (a) If g1(t) is uniformly sampled at the rate of fs400 Hz, show the resulting spectrum of the ideally sampled signal. (b) If we attempt to reconstruct gi (t) from the samples in Part (a), what will be the recovered analog signal in both time and frequency domains? (c) Determine another analog signal G2(f) in frequency domain such that its samples at = 400 Hz will lead to the same...
please, provide answer along with its matlab code. 10. Consider the continuous- time signal kite a1ua(-t) + kze-a2t...
 please, provide answer along with its matlab code.
10. Consider the continuous- time signal kite a1ua(-t) + kze-a2t cos (2mfi t) ua (t), Ta(t) where ki =-400, k2 2, a1 = -57.5364, a2 21.0721, and fi=300 Hz. (a) Plot ra(t). Identify the non-causal part of Ta (t) as Tal(t) and the causal part as Ta2(t). (b) Assuming that aa(t) is sampled using the sampling frequency fsamp 200 Hz, determine the discrete-time counter-parts corresponding to aal (t) and ra2(t), named a1(n)...
please, provide answer along with its matlab code.
10. Consider the continuous- time signal kite a1ua(-t) + kze-a2t cos (2mfi t) ua (t), Ta(t) where ki =-400, k2 2, a1 = -57.5364, a2 21.0721, and fi=300 Hz. (a) Plot ra(t). Identify the non-causal part of Ta (t) as Tal(t) and the causal part as Ta2(t). (b) Assuming that aa(t) is sampled using the sampling frequency fsamp 200 Hz, determine the discrete-time counter-parts corresponding to aal (t) and ra2(t), named a1(n)...
3 Sampling and aliasing The aim of this part is to demonstrate the effects of aliasing...
 3 Sampling and aliasing The aim of this part is to demonstrate the effects of aliasing arising from improper sampling. A given analog signal z(t) is sampled at a rate fs = 1/T, the resulting samples (nT) are then reconstructed by an ideal reconstructor into the analog signal rat). Improper choice of f, will result in different signals ra(t) + (t), even though they agree at their sample values, that is, tanT) = x(nT). The procedure is illustrated by the...
3. (a) Consider the signal xc(t)-sin(2π(40)t). How fast must xe(t) be sanpled to avoid aliasing? ...
 3. (a) Consider the signal xc(t)-sin(2π(40)t). How fast must xe(t) be sanpled to avoid aliasing? Determine the Nyquist rate (the frequency which the sampling rate fs must exceed) for ae(t) (b) Consider processing the signal xe(t) (from part (a)) using the system shown below: Conversion to a sequence Conversion to an impulse train Ideal Reconstruction Filter Hr(ju) p (t) ур y(t) The sampling period for this system is T-1/50 seconds. The DT system H(ei2) is an ideal lowpass filter with...
THTCos (200Tt) -oo<t< oo. We want to convert = {0,1,2,...} Problem 1. Suppose we have a continuous-time signal r(...
 THTCos (200Tt) -oo<t< oo. We want to convert = {0,1,2,...} Problem 1. Suppose we have a continuous-time signal r(t) (t) into a discrete-time signal yn] where we sample the signal every t= nT, seconds for n a. Determine the frequency fo of the cosine in Hertz and its corresponding period (T = 1/fo). b. Plot the continuous signal rt) for t = [0,4T] seconds so that four periods of the signal are plot command) plotted (use the (0, 1, 2,...
Problem 1: (3 +2+3+2 10, sampling) Consider the continuous-time signal x(t) = 3 + cos(10?1+ 5)...
 Problem 1: (3 +2+3+2 10, sampling) Consider the continuous-time signal x(t) = 3 + cos(10?1+ 5) + sin(15?), t E R (a) Find the Fourier transform X-Fr. Hint: (F ejuot) (w) 2??(w-wo) (b) What is the Nyquist Frequency wn in radians/s of x? (c) Write an expression for the Fourier transform of the ideal sampling of x with sam- pling period T, = 2n/Cav.), i.e., ?00_ox(AZ)6(t-kZ) Hint: (F eiru>tz(t) (w) - X(w - rus) and recall Poisson's identity, CO eyru'st,...
 ints) A continuous time signal is given below: x(t) = 10 + 3 sin (20t + 3) + 5 cos(40π) This is sampled at t = 0.01 n to get a the discrete-time signal x[n], which is then applied to an ideal DAC to obtain a reconstructed continuous time signal y(t). a. i. Determine x[n] and graph its samples, using Matlab, along with the signal x(t) in one plot, plot a few cycles of x(t). ii. Determine the reconstructed signal,...
 PROBLEM 2 150 pts.] A signal is consist of three sine functions: the first one, , has a wave frequency of 50 Hz, the second one, 2, has 100 Hz, and the last one, r3, has 200 Hz. However, each function has different amplitude: the amplitude of the first signal component x! is 10 cm, the amplitude of the second signal component xi s 5 cm; and the amplitude of the last signal component t3 is 1 cm. As a...
 10. Find the Fourier transform of a continuous-time signal x(t) = 10e Su(t). Plot the magnitude spectrum and the phase spectrum. If the signal is going to be sampled, what should be the minimum sampling frequency so that the aliasing error is less than 0.1 % of the maximum original magnitude at half the sampling frequency. 11. A signal x(t) = 5cos(2nt + 1/6) is sampled at every 0.2 seconds. Find the sequence obtained over the interval 0 st 3...
 5.1-7 Consider a bandlimited signal g1(C) whose Fourier transform is (a) If g1(t) is uniformly sampled at the rate of fs400 Hz, show the resulting spectrum of the ideally sampled signal. (b) If we attempt to reconstruct gi (t) from the samples in Part (a), what will be the recovered analog signal in both time and frequency domains? (c) Determine another analog signal G2(f) in frequency domain such that its samples at = 400 Hz will lead to the same...
 please, provide answer along with its matlab code.
10. Consider the continuous- time signal kite a1ua(-t) + kze-a2t cos (2mfi t) ua (t), Ta(t) where ki =-400, k2 2, a1 = -57.5364, a2 21.0721, and fi=300 Hz. (a) Plot ra(t). Identify the non-causal part of Ta (t) as Tal(t) and the causal part as Ta2(t). (b) Assuming that aa(t) is sampled using the sampling frequency fsamp 200 Hz, determine the discrete-time counter-parts corresponding to aal (t) and ra2(t), named a1(n)...
please, provide answer along with its matlab code.
10. Consider the continuous- time signal kite a1ua(-t) + kze-a2t cos (2mfi t) ua (t), Ta(t) where ki =-400, k2 2, a1 = -57.5364, a2 21.0721, and fi=300 Hz. (a) Plot ra(t). Identify the non-causal part of Ta (t) as Tal(t) and the causal part as Ta2(t). (b) Assuming that aa(t) is sampled using the sampling frequency fsamp 200 Hz, determine the discrete-time counter-parts corresponding to aal (t) and ra2(t), named a1(n)...
 3 Sampling and aliasing The aim of this part is to demonstrate the effects of aliasing arising from improper sampling. A given analog signal z(t) is sampled at a rate fs = 1/T, the resulting samples (nT) are then reconstructed by an ideal reconstructor into the analog signal rat). Improper choice of f, will result in different signals ra(t) + (t), even though they agree at their sample values, that is, tanT) = x(nT). The procedure is illustrated by the...
 3. (a) Consider the signal xc(t)-sin(2π(40)t). How fast must xe(t) be sanpled to avoid aliasing? Determine the Nyquist rate (the frequency which the sampling rate fs must exceed) for ae(t) (b) Consider processing the signal xe(t) (from part (a)) using the system shown below: Conversion to a sequence Conversion to an impulse train Ideal Reconstruction Filter Hr(ju) p (t) ур y(t) The sampling period for this system is T-1/50 seconds. The DT system H(ei2) is an ideal lowpass filter with...
 THTCos (200Tt) -oo<t< oo. We want to convert = {0,1,2,...} Problem 1. Suppose we have a continuous-time signal r(t) (t) into a discrete-time signal yn] where we sample the signal every t= nT, seconds for n a. Determine the frequency fo of the cosine in Hertz and its corresponding period (T = 1/fo). b. Plot the continuous signal rt) for t = [0,4T] seconds so that four periods of the signal are plot command) plotted (use the (0, 1, 2,...
 Problem 1: (3 +2+3+2 10, sampling) Consider the continuous-time signal x(t) = 3 + cos(10?1+ 5) + sin(15?), t E R (a) Find the Fourier transform X-Fr. Hint: (F ejuot) (w) 2??(w-wo) (b) What is the Nyquist Frequency wn in radians/s of x? (c) Write an expression for the Fourier transform of the ideal sampling of x with sam- pling period T, = 2n/Cav.), i.e., ?00_ox(AZ)6(t-kZ) Hint: (F eiru>tz(t) (w) - X(w - rus) and recall Poisson's identity, CO eyru'st,...
Most questions answered within 3 hours.
-
What is the % w/v when 80 mL of a 2.0% solution is mixed with 50...
asked 1 minute ago -
How can I solve the following using a TI83
Claim: Most adults would erase all of...
asked 13 minutes ago -
Analysis of 3-ethyl-3-buten-2-ol gave C, 72.13%; H, 11.92%.
Calculate the percent deviation of these results from...
asked 10 minutes ago -
Which VALS segment is most likely to have a top of the line
brand new (2015)...
asked 14 minutes ago -
Write a program to score the paper-rock-scissor game. Each of
two users types in either P,R...
asked 34 minutes ago -
Calculate the equillibrium constent K for a redox reaction that
has E°cell = -.98 V at...
asked 46 minutes ago -
A concave spherical mirror has a radius of curvature of
magnitude 19.6 cm.
(a) Find the...
asked 48 minutes ago -
3. draw a diagram of the magnetic field:
a. around a long straight wire with a...
asked 46 minutes ago -
If you titrated 30.0 mL of 0.1 M HCl with 0.1 M NaOH, indicate
the approximate...
asked 55 minutes ago -
NADH passes electrons into the electron transport chain. List
the carriers that would receive the electrons,...
asked 1 hour ago -
A cylindrical cable with a resistivity of 1.6x10⁻⁸ Ω·m and cross
sectional area of 3x10⁻⁵ m^2...
asked 1 hour ago -
True or False.
A consumer with convex preferences who is indifferent between
the bundles (5,2) and...
asked 1 hour ago