For the following question, please use symbolic toolbox to compose proper math equation and signal. And use MATLAB graphical functions to show the waveform. Question) a)Create a symbol x, and show si...
Homework Answers


Add Answer to:
For the following question, please use symbolic toolbox to compose proper math equation and signal. And use MATLAB graphical functions to show the waveform. Question) a)Create a symbol x, and show si...
For the following question, please use symbolic toolbox to compose proper math equation and signal. And use MATLAB graphical functions to show the waveform. Question) Create a symbol x, and sh...
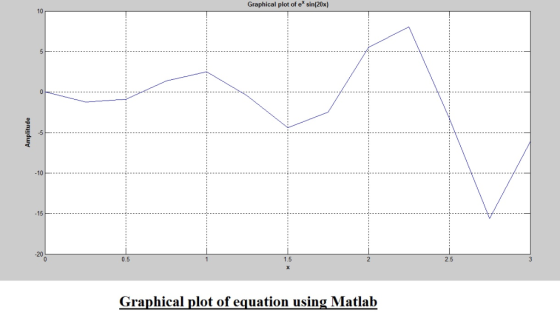
 For the following question, please use symbolic toolbox to
compose proper math equation and signal. And use MATLAB graphical
functions to show the waveform.
Question)
Create a symbol x, and show the piecewise signal y below over interval from -5 to +5 x, x20 .On the same figure, show the differentiate and integrate waveform of signal y over interval from 5 and+5
Create a symbol x, and show the piecewise signal y below over interval from -5 to +5 x,...
For the following question, please use symbolic toolbox to
compose proper math equation and signal. And use MATLAB graphical
functions to show the waveform.
Question)
Create a symbol x, and show the piecewise signal y below over interval from -5 to +5 x, x20 .On the same figure, show the differentiate and integrate waveform of signal y over interval from 5 and+5
Create a symbol x, and show the piecewise signal y below over interval from -5 to +5 x,...
Question: Use MATLAB to solve it,uing MATLAB built in functions is not allowed.Write a MATLAB algorithm that does these 3. Use any method you want and compute the following double integral: edrdy (a)...
 Question: Use MATLAB to solve it,uing MATLAB built in functions is not allowed.Write a MATLAB algorithm that does these 3. Use any method you want and compute the following double integral: edrdy (a) (12 points) The domain of integral 2 is 0 SE1, 0y (b) (8 points) S2 is the first quadrant in the unit circle: z > 0, y > 0,T2 + y2 < 1. HINT: to calculate double integral, you basically are doing a nested numerical integral. Find...
Using MATLAB, duplicate to the two graphs shown in the figure below Requirements 1. Show the MATLAB code used to plot both functions 5cos (nt-ng) (V) 5 e-"X cos (2nft-2nx/A) (V) a. y b- Use the f...
 Using MATLAB, duplicate to the two graphs shown in the figure below Requirements 1. Show the MATLAB code used to plot both functions 5cos (nt-ng) (V) 5 e-"X cos (2nft-2nx/A) (V) a. y b- Use the frequency, wavelength and attenuation shown in the figure below when plotting graph (b) 2. 3. 4. Place labels for the x and y axis showing appropriate units Extend the x-axis to 10 cm and use a sampling rate of 0.1 mm Submit the final...
Please show matlab editor and command window B. (4 pts) Use the : operator to create...
 Please show matlab editor and command window
B. (4 pts) Use the : operator to create the vectors x [2.5,1.50.5,-0.5,-1.51 and y [0.4,0.8,1.2,1.6,2], then use them in the following expression to compute vector z using element-by-element calculations C. (8 pts) A 70 lb bag of rice is being pulled by applying a force F at an angle θ as shown. The force required to drag the bag is given by: θ μ sin θ + cos θ Where u-0.35 is...
Please show matlab editor and command window
B. (4 pts) Use the : operator to create the vectors x [2.5,1.50.5,-0.5,-1.51 and y [0.4,0.8,1.2,1.6,2], then use them in the following expression to compute vector z using element-by-element calculations C. (8 pts) A 70 lb bag of rice is being pulled by applying a force F at an angle θ as shown. The force required to drag the bag is given by: θ μ sin θ + cos θ Where u-0.35 is...
Compute the following problems using Math Lab. Instructions: Answer All Questions using MATLAB commands. Question 1....
 Compute the following problems using Math
Lab.
Instructions: Answer All Questions using MATLAB commands. Question 1. Create a vector of the even whole numbers between 31 and 75. Question 2. Let x [2516] a. Add 16 to each element b. Add 3 to just the odd-index elcments c. Compute the square root of each element d. Compute the square of each element Question 3. Let x 13 268T and y [4 1 3 5] (NB. x and y should be...
Compute the following problems using Math
Lab.
Instructions: Answer All Questions using MATLAB commands. Question 1. Create a vector of the even whole numbers between 31 and 75. Question 2. Let x [2516] a. Add 16 to each element b. Add 3 to just the odd-index elcments c. Compute the square root of each element d. Compute the square of each element Question 3. Let x 13 268T and y [4 1 3 5] (NB. x and y should be...
Write a MATLAB Graphical User Interface (GUI) to simulate and plot the projectile motion – the...
Write a MATLAB Graphical User Interface (GUI) to simulate and plot the projectile motion – the motion of an object projected into the air at an angle. The object flies in the air until the projectile returns to the horizontal axis (x-axis), where y=0. This MATLAB program should allow the user to try to hit a 2-m diameter target on the x-axis (y=0) by varying conditions, including the lunch direction, the speed of the lunch, the projectile’s size, and the...
Please use Excel, and show all functions. 3. Answer the following question for where Y has...
 Please use Excel, and show all functions.
3. Answer the following question for where Y has been regressed on X1, X2, and X3. Use the linear regression output in the Excel file. Your answers should be rounded to 2 decimal places. a. What is the equation for the line of best fit or regression line? b. The proportion is for the amount of the variability of Y that is explained or accounted for by the model. C. The correlation between...
Please use Excel, and show all functions.
3. Answer the following question for where Y has been regressed on X1, X2, and X3. Use the linear regression output in the Excel file. Your answers should be rounded to 2 decimal places. a. What is the equation for the line of best fit or regression line? b. The proportion is for the amount of the variability of Y that is explained or accounted for by the model. C. The correlation between...
 For the following question, please use symbolic toolbox to
compose proper math equation and signal. And use MATLAB graphical
functions to show the waveform.
Question)
Create a symbol x, and show the piecewise signal y below over interval from -5 to +5 x, x20 .On the same figure, show the differentiate and integrate waveform of signal y over interval from 5 and+5
Create a symbol x, and show the piecewise signal y below over interval from -5 to +5 x,...
For the following question, please use symbolic toolbox to
compose proper math equation and signal. And use MATLAB graphical
functions to show the waveform.
Question)
Create a symbol x, and show the piecewise signal y below over interval from -5 to +5 x, x20 .On the same figure, show the differentiate and integrate waveform of signal y over interval from 5 and+5
Create a symbol x, and show the piecewise signal y below over interval from -5 to +5 x,...
 Question: Use MATLAB to solve it,uing MATLAB built in functions is not allowed.Write a MATLAB algorithm that does these 3. Use any method you want and compute the following double integral: edrdy (a) (12 points) The domain of integral 2 is 0 SE1, 0y (b) (8 points) S2 is the first quadrant in the unit circle: z > 0, y > 0,T2 + y2 < 1. HINT: to calculate double integral, you basically are doing a nested numerical integral. Find...
 Using MATLAB, duplicate to the two graphs shown in the figure below Requirements 1. Show the MATLAB code used to plot both functions 5cos (nt-ng) (V) 5 e-"X cos (2nft-2nx/A) (V) a. y b- Use the frequency, wavelength and attenuation shown in the figure below when plotting graph (b) 2. 3. 4. Place labels for the x and y axis showing appropriate units Extend the x-axis to 10 cm and use a sampling rate of 0.1 mm Submit the final...
 Please show matlab editor and command window
B. (4 pts) Use the : operator to create the vectors x [2.5,1.50.5,-0.5,-1.51 and y [0.4,0.8,1.2,1.6,2], then use them in the following expression to compute vector z using element-by-element calculations C. (8 pts) A 70 lb bag of rice is being pulled by applying a force F at an angle θ as shown. The force required to drag the bag is given by: θ μ sin θ + cos θ Where u-0.35 is...
Please show matlab editor and command window
B. (4 pts) Use the : operator to create the vectors x [2.5,1.50.5,-0.5,-1.51 and y [0.4,0.8,1.2,1.6,2], then use them in the following expression to compute vector z using element-by-element calculations C. (8 pts) A 70 lb bag of rice is being pulled by applying a force F at an angle θ as shown. The force required to drag the bag is given by: θ μ sin θ + cos θ Where u-0.35 is...
 Compute the following problems using Math
Lab.
Instructions: Answer All Questions using MATLAB commands. Question 1. Create a vector of the even whole numbers between 31 and 75. Question 2. Let x [2516] a. Add 16 to each element b. Add 3 to just the odd-index elcments c. Compute the square root of each element d. Compute the square of each element Question 3. Let x 13 268T and y [4 1 3 5] (NB. x and y should be...
Compute the following problems using Math
Lab.
Instructions: Answer All Questions using MATLAB commands. Question 1. Create a vector of the even whole numbers between 31 and 75. Question 2. Let x [2516] a. Add 16 to each element b. Add 3 to just the odd-index elcments c. Compute the square root of each element d. Compute the square of each element Question 3. Let x 13 268T and y [4 1 3 5] (NB. x and y should be...
 Please use Excel, and show all functions.
3. Answer the following question for where Y has been regressed on X1, X2, and X3. Use the linear regression output in the Excel file. Your answers should be rounded to 2 decimal places. a. What is the equation for the line of best fit or regression line? b. The proportion is for the amount of the variability of Y that is explained or accounted for by the model. C. The correlation between...
Please use Excel, and show all functions.
3. Answer the following question for where Y has been regressed on X1, X2, and X3. Use the linear regression output in the Excel file. Your answers should be rounded to 2 decimal places. a. What is the equation for the line of best fit or regression line? b. The proportion is for the amount of the variability of Y that is explained or accounted for by the model. C. The correlation between...
Most questions answered within 3 hours.
-
Problem: The equilibrium constant, Keq, is 5 x 10^-11 m HCO3
<-----------> H^+ + CO3^-2 Calculate...
asked 2 minutes ago -
Explain how blackbody radiation led to the idea of "quanta."
Will rate answer!
asked 8 minutes ago -
Two noble gases (Ne and He) are injected into the chambers of an
insulated container. Each...
asked 3 minutes ago -
Suppose you purchase a zero coupon bond with a face value of
$1,000, maturing in 18...
asked 8 minutes ago -
Do you believe that the $785,000 amount at the center of the
Overstock-Grant Thornton dispute was...
asked 9 minutes ago -
Find and , the mean and standard deviation of the
sampling distribution of :
μ = 25,...
asked 33 minutes ago -
According to the manufacturer of a certain candy, 9% of the
candy produced are red. If...
asked 51 minutes ago -
A Eucher Deck consists of 24 cards. In a four- player game, each
player is dealt...
asked 1 hour ago -
This is a challenging question.
The titration of an impure sample of KHP found that 36.00...
asked 1 hour ago -
1. Starting from rest, an automatic subway train is controlled
by a computer
that causes it’s...
asked 33 minutes ago -
You place a block of
ice (mass of 3 kg) into a test chamber filled with...
asked 1 hour ago -
If a benzene ring has one -CF3 group as a
substituent, will the next substituent add...
asked 57 minutes ago