
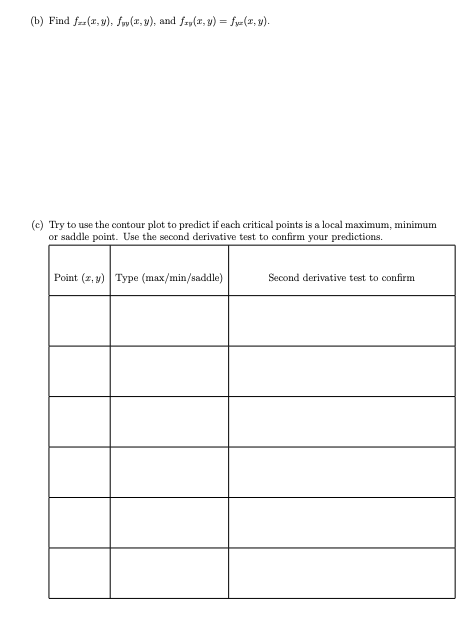
(b) Find f-,) v(,),and fp()-fy(, y) (c) Try to use the contour plot to predict if each critical points is a local maximum, minimum or saddle point. Use the second derivative test to confirm your predictions. Point (z, ) Type (max/min/saddle) Second derivative test to confirm
Homework Answers


Add Answer to:
1. (25 points) The figure below shows the contour plot of f(x,y)-3 -1 - 2y+y. (Credit for the figure is due to UMich instructors.) 6.00U 6.000 1.5 1.0 0.5 0.0 0.5 1.0 1.5 6.000 2.0-1.5-1.0-0.5 0.0 0....
Use the contours of the figure to predict the location of the critical points of f...
 Use the contours of the figure to predict the location of the critical points of f and whether f has a saddle point or a local maximum or a local minimum at each of these critical points. Explain your reasoning. Then apply the second derivative test to confirm your calculations.
please do it step by step.f(x,y)=3x-x³-2y²+y⁴
Use the contours of the figure to predict the location of the critical points of f and whether f has a saddle point or a local maximum or a local minimum at each of these critical points. Explain your reasoning. Then apply the second derivative test to confirm your calculations.
please do it step by step.f(x,y)=3x-x³-2y²+y⁴
Let f(x,y) = 4 + x² + y² – 3xy f has critical points at 10,0)...
 Let f(x,y) = 4 + x² + y² – 3xy f has critical points at 10,0) and (1,1) use the second derivative test to classify these points as local min, local max, or saddle point
Question 6. (20 pts) Find the critical points of f(x, y) = x4 + 2y2 –...
 Question 6. (20 pts) Find the critical points of f(x, y) = x4 + 2y2 – 4xy. Then use the Second Derivative Test to determine whether each critical point is a local min, max, or saddle point.
This two-variable function has exactly two critical points, including the origin: 43 13 f(x,y) = xy...
 This two-variable function has exactly two critical points, including the origin: 43 13 f(x,y) = xy - Q17.1 FR 5 Part (a) 4 Points Find the second critical point, other than (0,0). Please select file(s) Select file(s) Q17.2 FR 5 Part (b) 4 Points Classify the critical point (0,0) as a local min, local max, or saddle point, using the (multivariate) second-derivative test.
pls solve like example Assign 7.3.25 Find all local extrema for the function f(x,y) = x3...
 pls
solve like example
Assign 7.3.25 Find all local extrema for the function f(x,y) = x3 - 12xy + y. Find the local maxima. Select the correct choice below and, if necessary, fill in the answer box to complete your choice. There are local maxima located at (Type an ordered pair. Use a comma to separate answers as needed.) OB. There are no local maxima. Question Hel Find all local extrema for the function f(x,y)=x°-21xy+y3. The function will have local...
pls
solve like example
Assign 7.3.25 Find all local extrema for the function f(x,y) = x3 - 12xy + y. Find the local maxima. Select the correct choice below and, if necessary, fill in the answer box to complete your choice. There are local maxima located at (Type an ordered pair. Use a comma to separate answers as needed.) OB. There are no local maxima. Question Hel Find all local extrema for the function f(x,y)=x°-21xy+y3. The function will have local...
 Use the contours of the figure to predict the location of the critical points of f and whether f has a saddle point or a local maximum or a local minimum at each of these critical points. Explain your reasoning. Then apply the second derivative test to confirm your calculations.
please do it step by step.f(x,y)=3x-x³-2y²+y⁴
Use the contours of the figure to predict the location of the critical points of f and whether f has a saddle point or a local maximum or a local minimum at each of these critical points. Explain your reasoning. Then apply the second derivative test to confirm your calculations.
please do it step by step.f(x,y)=3x-x³-2y²+y⁴
 Let f(x,y) = 4 + x² + y² – 3xy f has critical points at 10,0) and (1,1) use the second derivative test to classify these points as local min, local max, or saddle point
 Question 6. (20 pts) Find the critical points of f(x, y) = x4 + 2y2 – 4xy. Then use the Second Derivative Test to determine whether each critical point is a local min, max, or saddle point.
 This two-variable function has exactly two critical points, including the origin: 43 13 f(x,y) = xy - Q17.1 FR 5 Part (a) 4 Points Find the second critical point, other than (0,0). Please select file(s) Select file(s) Q17.2 FR 5 Part (b) 4 Points Classify the critical point (0,0) as a local min, local max, or saddle point, using the (multivariate) second-derivative test.
 pls
solve like example
Assign 7.3.25 Find all local extrema for the function f(x,y) = x3 - 12xy + y. Find the local maxima. Select the correct choice below and, if necessary, fill in the answer box to complete your choice. There are local maxima located at (Type an ordered pair. Use a comma to separate answers as needed.) OB. There are no local maxima. Question Hel Find all local extrema for the function f(x,y)=x°-21xy+y3. The function will have local...
pls
solve like example
Assign 7.3.25 Find all local extrema for the function f(x,y) = x3 - 12xy + y. Find the local maxima. Select the correct choice below and, if necessary, fill in the answer box to complete your choice. There are local maxima located at (Type an ordered pair. Use a comma to separate answers as needed.) OB. There are no local maxima. Question Hel Find all local extrema for the function f(x,y)=x°-21xy+y3. The function will have local...
Most questions answered within 3 hours.
-
IN PYTHON ONLY !! Program 2: Re-work
program #5 (WeeklyHours) from the previous assignment such that...
asked 32 minutes ago -
The average length of time between arrivals at a turnpike
toll-booth is 26 seconds. What is...
asked 2 hours ago -
(a) A piston at 6.1 atm contains a gas that occupies a volume of
3.5 L....
asked 3 hours ago -
Please answer true or false. Words
cannot be changed or added in to make it true...
asked 3 hours ago -
An empty test tube weighs 15.923 grams. Then,
MgCl2•6H2O is added into the test tube. After...
asked 3 hours ago -
Assume memory access is 10 units of time and disk access is
10000 units of time....
asked 3 hours ago -
1. Are all good samples random?
2. Magazines often report surveys giving statistics such as “63%...
asked 4 hours ago -
Under all the various types of market structures, firms
must eventually earn some economic profits for...
asked 3 hours ago -
Consider the following fitness regime for a single locus trait
with two co-dominant alleles: w11 =...
asked 3 hours ago -
A large cable company reports the following.
80% of its customers subscribe to its cable TV...
asked 4 hours ago -
Please answer the question in brief.
Discuss the role of ERP in organizations. Are ERP tools...
asked 3 hours ago -
Discuss the pros and cons of collaborative software such
as SameTime. Does it increase productivity? What...
asked 4 hours ago