Binary mixture at vapor-liquid equilibrium at constant temperature has total pressure P=1.57 bar at x1=0.3. The vapor pressures of pure components are P1=2.06 bar and P2=1.13 bar, respectively. Assume...
Binary mixture at vapor-liquid equilibrium at constant temperature has total pressure P=1.57 bar at x1=0.3. The vapor pressures of pure components are P1=2.06 bar and P2=1.13 bar, respectively. Assume that the vapor phase is ideal and the liquid phase non-ideality can be described by 1-parameter Margules equation .
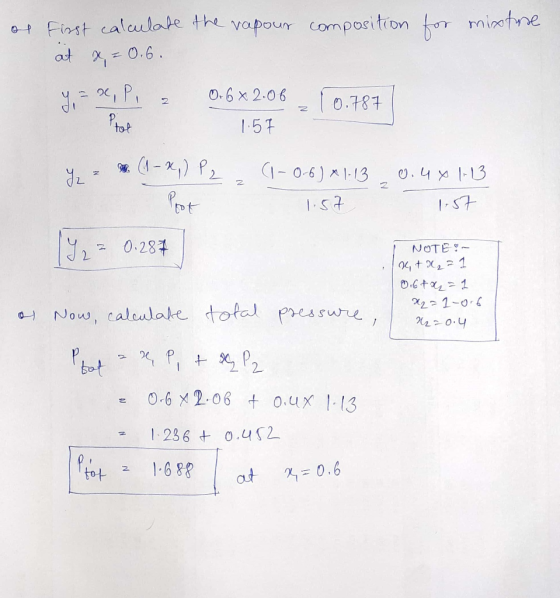
Calculate the total pressure and the vapor composition for this mixture at x1=0.6 at the same temperature
Homework Answers
Add Answer to:
Binary mixture at vapor-liquid equilibrium at constant temperature has total pressure P=1.57 bar at x1=0.3. The vapor pressures of pure components are P1=2.06 bar and P2=1.13 bar, respectively. Assume...
At 250C, the vapor pressure of pure pentane, n-C5H12 is 0.674 bar and that of pure hexane, n-C6H14 is 0.198 bar. Assumi...
At 250C, the vapor pressure of pure pentane, n-C5H12 is 0.674 bar and that of pure hexane, n-C6H14 is 0.198 bar. Assuming these two compounds form an ideal solution: Prepare a pressure-composition (p vs mole fraction) diagram for this binary system. Calculate the partial pressure of each substance and the total pressure over the solution that has a mole fraction of pentane, Xn-C5H12=0.35 What is the composition of the vapor phase in equilibrium with the solution that has the same composition...
6. At 25°C, the vapor pressure of pure pentane, n-CsH12 is 0.674 bar and that of...
 6. At 25°C, the vapor pressure of pure pentane, n-CsH12 is 0.674 bar and that of pure hexane, n- C6H14 is 0.198 bar. Assuming these two compounds form an ideal solution: (a) Prepare a pressure-composition (p vs mole fraction) diagram for this binary system. (b) Calculate the partial pressure of each substance and the total pressure over the solution that has a mole fraction of pentane, Xcm.=0.35 (c) What is the composition of the vapor phase in equilibrium with the...
9.9 Table 9.9 lists measured values of gas-phase composition and total pressure for the binary two-phase...
 9.9 Table 9.9 lists measured values of gas-phase composition and total pressure for the binary two-phase methanol-benzene system at constant temperature and varied liquid-phase compo- sition. XA is the mole fraction of methanol in the liquid mixture, and ya is the mole fraction of methanol in the equilibrated gas phase. (a) For each of the 16 different liquid-phase compositions, tabulate the pyrtial pressures of A and B in the equilibrated gas phase. (b) Plot PA and Ps versus xA on...
 6. At 25°C, the vapor pressure of pure pentane, n-CsH12 is 0.674 bar and that of pure hexane, n- C6H14 is 0.198 bar. Assuming these two compounds form an ideal solution: (a) Prepare a pressure-composition (p vs mole fraction) diagram for this binary system. (b) Calculate the partial pressure of each substance and the total pressure over the solution that has a mole fraction of pentane, Xcm.=0.35 (c) What is the composition of the vapor phase in equilibrium with the...
 9.9 Table 9.9 lists measured values of gas-phase composition and total pressure for the binary two-phase methanol-benzene system at constant temperature and varied liquid-phase compo- sition. XA is the mole fraction of methanol in the liquid mixture, and ya is the mole fraction of methanol in the equilibrated gas phase. (a) For each of the 16 different liquid-phase compositions, tabulate the pyrtial pressures of A and B in the equilibrated gas phase. (b) Plot PA and Ps versus xA on...
Most questions answered within 3 hours.
-
Given input { 66, 28, 43, 29, 44, 69, 19 } and a hash function
h(x)...
asked 4 minutes ago -
A pebble with mass m is thrown straight up with an initial speed
v0 so that...
asked 8 minutes ago -
Let X be a discrete random variable that follows a
binomial distribution with n = 11...
asked 17 minutes ago -
The equilibrium constant, K, for the following reaction is
1.29×10⁻² at 600
K.
COCl2(g) --->
CO(g)...
asked 30 minutes ago -
It is known that 72% of people have a favorable opinion of their
local police force....
asked 33 minutes ago -
A vertical straight wire carrying an upward 26-A current exerts
an attractive force per unit length...
asked 46 minutes ago -
For the purposes of this assignment, you are to choose an
adaptive trait common to more...
asked 54 minutes ago -
Two identical flutes can play middle C (262 Hz) at 20◦C. How
many beats per second...
asked 1 hour ago -
Potassium phosphate and calcium chloride react in a double
replacement reaction. To produce 1.0 moles of...
asked 57 minutes ago -
Sparky, Co. purchased land as a factory site for $600,000.
Sparky paid $42,000 to tear down...
asked 1 hour ago -
A Chi-square distribution with 14 degrees of freedom is a
correct model for
Question 8 options:...
asked 1 hour ago -
In a group of 45 mice, there are 10 that have a certain genetic
character. suppose...
asked 1 hour ago