URGENT PLEASE HELP!
The director of a training program for a large insurance company has the business objective of determining which training method is best for training underwriters. The three methods to be evaluated are classroom, online, and courseware app. The 30 trainees are divided into three randomly assigned groups of 10. Before the start of the training, each trainee is given a proficiency exam that measures mathematics and computer skills. At the end of the training, all students take the same end-of-training exam. Develop a multiple regression model to predict the score on the end-of-training exam, based on the score on the proficiency exam and the method of training used. Complete parts a through f below.


 THE BLANKS ARE JUST "INCREASE"
OR "DECREASE"
THE BLANKS ARE JUST "INCREASE"
OR "DECREASE"
otherwise. Define the dummy variable X3 as X31 if the training method is online, X3 0 otherwise Зі Round to three decimal places as needed.) b. Interpret the regression coefficients in (a) Taking into account the effect of the training method, for each additional point scored on the proficiency exam, the predicted end-of-training exam score is estimated to by points. Holding constant the score on the proficiency exam, the estimated effect of an underwriter being trained by the classroom the end-oaf raining exam score bypoints. Holding constant the score on method rather than the courseware app method or the online method is to the proficiency exam, the estimated effect of an underwriter being trained by the online method rather than the courseware app method or the classroom method is the end-of-training exam score bypoints. to the end-of-training exam score by points. to (Round to three decimal places as needed.)
c. At the 0.05 level of significance, determine whether each independent variable makes a contribution to the regression model. Determine the hypotheses. Choose the correct answer below. H1: At least one of the coefficients are not 0. Find the t statistic for β1 . t statistic(Round to two decimal places as needed.) Find the probability of getting a t statistic at least this extreme. p-value (Round to three decimal places as needed.)
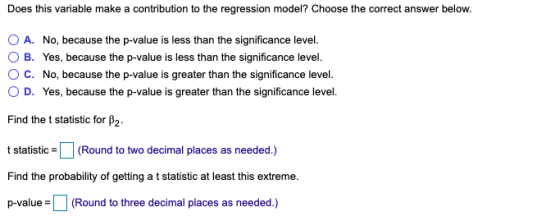
Does this variable make a contribution to the regression model? Choose the correct answer below. O A. No, because the p-value is less than the significance level 0 B. Yes, because the p-value is less than the significance level. ° C. No, because the p-value is greater than the significance level. 0 D. Yes, because the p-value is greater than the significance level Find the t statistic for p2 t statistic (Round to two decimal places as needed.) Find the probability of getting a t statistic at least this extreme. p-value(Round to three decimal places as needed.)
Does this variable make a contribution to the regression model? Choose the correct answer below. O A. No, because the p-value is less than the significance level. ( B. Yes, because the p-value is less than the significance level. C. No, because the p-value is greater than the significance level. D. Yes, because the p-value is greater than the significance level. Find the t statistic for B3. statistic(Round to two decimal places as needed.) Find the probability of getting a t statistic at least this extreme. p-value-(Round to three decimal places as needed.)
Homework Answers
(a)
| y | X1 | X2 | X3 |
| 14 | 94 | 1 | 0 |
| 18 | 96 | 1 | 0 |
| 18 | 97 | 1 | 0 |
| 39 | 101 | 1 | 0 |
| 40 | 101 | 1 | 0 |
| 26 | 105 | 1 | 0 |
| 41 | 110 | 1 | 0 |
| 28 | 110 | 1 | 0 |
| 36 | 111 | 1 | 0 |
| 65 | 130 | 1 | 0 |
| 37 | 79 | 0 | 1 |
| 35 | 85 | 0 | 1 |
| 43 | 90 | 0 | 1 |
| 44 | 97 | 0 | 1 |
| 61 | 97 | 0 | 1 |
| 62 | 112 | 0 | 1 |
| 93 | 115 | 0 | 1 |
| 74 | 117 | 0 | 1 |
| 76 | 120 | 0 | 1 |
| 79 | 119 | 0 | 1 |
| 55 | 92 | 0 | 0 |
| 53 | 95 | 0 | 0 |
| 54 | 100 | 0 | 0 |
| 52 | 102 | 0 | 0 |
| 34 | 102 | 0 | 0 |
| 47 | 104 | 0 | 0 |
| 57 | 106 | 0 | 0 |
| 55 | 109 | 0 | 0 |
| 41 | 111 | 0 | 0 |
| 80 | 117 | 0 | 0 |
(b) using software the regression alalysis showed following information
| Analysis of Variance | |||||
| Source | DF | Sum of | Mean | F Value | Pr > F |
| Squares | Square | ||||
| Model | 3 | 8689.38517 | 2896.46 | 30.91 | <.0001 |
| Error | 26 | 2435.98149 | 93.6916 | ||
| Corrected Total | 29 | 11125 | |||
| Root MSE | 9.67944 | R-Square | 0.781 | ||
| Dependent Mean | 48.56667 | Adj R-Sq | 0.7558 | ||
| Coeff Var | 19.93022 | ||||
| Parameter Estimates | |||||
| Variable | DF | Parameter | Standard | t Value | Pr > |t| |
| Estimate | Error | ||||
| Intercept | 1 | -63.47383 | 17.0023 | -3.73 | 0.0009 |
| X1 | 1 | 1.12017 | 0.16112 | 6.95 | <.0001 |
| X2 | 1 | -22.20429 | 4.33744 | -5.12 | <.0001 |
| X3 | 1 | 8.38412 | 4.33025 | 1.94 | 0.0638 |
regression equation y=-63.47+1.12X1-22.2X2+8.38X3
(b and c) X1 has significant positive impact and X2 has significant negative impact, X3 has non-significant positive impact at 5% level of significance
(d) (1-alpha)*100% confidence interval for beta=beta±t(alpha/2,error df)*SE(beta)
95% confidence interval for X1=1.12±t(0.05/2, 26)*0.1611=1.12±2.06*0.1611=1.12±0.33=(0.79,1.55)
95% confidence interval for X2=-22.2±t(0.05/2, 26)*4.34=-22.2±2.06*4.34=
95% confidence interval for X3=8.38±t(0.05/2, 26)*4.33=1.12±2.06*4.33
(e) after adding the interaction term the following information is generated, and none of the interaction term is significant at alpha=0.05 so adding interaction term is not required
| Analysis of Variance | |||||
| Source | DF | Sum of | Mean | F Value | Pr > F |
| Squares | Square | ||||
| Model | 5 | 8847.69985 | 1769.54 | 18.65 | <.0001 |
| Error | 24 | 2277.66682 | 94.90278 | ||
| Corrected Total | 29 | 11125 | |||
| Root MSE | 9.74181 | R-Square | 0.7953 | ||
| Dependent Mean | 48.56667 | Adj R-Sq | 0.7526 | ||
| Coeff Var | 20.05863 | ||||
| Parameter Estimates | |||||
| Variable | DF | Parameter | Standard | t Value | Pr > |t| |
| Estimate | Error | ||||
| Intercept | 1 | -9.32082 | 45.52686 | -0.2 | 0.8395 |
| X1 | 1 | 0.59847 | 0.4376 | 1.37 | 0.1841 |
| X2 | 1 | -88.94048 | 55.9612 | -1.59 | 0.1251 |
| X3 | 1 | -52.5468 | 50.60616 | -1.04 | 0.3095 |
| X12 | 1 | 0.64098 | 0.53458 | 1.2 | 0.2422 |
| X13 | 1 | 0.58745 | 0.48635 | 1.21 | 0.2389 |
X12 is interaction of X1 and X2
X13 iis interaction of X1 and X2
( f) first model is appropriate i.e. without interaction model
if you have any query just ask me how.i am here to helps you. dont give you direct thums down.if you satishfied to my work please give me vote for THUMS UP. THANK YOU SO MUCH
Add Answer to:
URGENT PLEASE HELP! The director of a training program for a large insurance company has the business objective of determining which training method is best for training underwriters. The three method...
The director of a training program for a large insurance company has the business objective of...
The director of a training program for a large insurance company has the business objective of determining which training method is best for training underwriters. The three methods to be evaluated are classroom, online, and courseware app. The 30 trainees are divided into three randomly assigned groups of 10. Before the start of the training, each trainee is given a proficiency exam that measures mathematics and computer skills. At the end of the training, all students take the same endof-...
A clinical trial was conducted using a new method designed to increase the probability of conceiving...
A clinical trial was conducted using a new method designed to increase the probability of conceiving a boy. As of this writing, 304 babies were born to parents using the new method, and 245 of them were boys. Use a 0.01 significance level to test the claim that the new method is effective in increasing the likelihood that a baby will be a boy. Identify the null hypothesis, alternative hypothesis, test statistic, P-value, conclusion about the null hypothesis, and final...
A business statistics professor at a college would like to develop a regression model to predict...
 A business statistics professor at a college would like to develop a regression model to predict the final exam scores for students based on their current GPS, the number of hours they studied for the exam and the number of times they were absent during the semester. The data for these variables are in the accompanying table Complete parts a through d below. ERE Click the icon to view the table of data a. Constructa regression models independent variables. Let...
please indicate all answers In a study of cell phone usage and brain hemispheric dominance, an...
 please indicate all answers
In a study of cell phone usage and brain hemispheric dominance, an Internet survey was e-maled to 6983 subjects randomly selected from an online group involved with ears. There were 1309 surveys returned. Use a 0.01 significance level to test the claim that the return rate is less than 20%. Use the P-value method and use the normal distribution as an approximation to the binomial distribution Identify the null hypothesis and alternative hypothesis OA. Ho:p<02 H:p0.2...
please indicate all answers
In a study of cell phone usage and brain hemispheric dominance, an Internet survey was e-maled to 6983 subjects randomly selected from an online group involved with ears. There were 1309 surveys returned. Use a 0.01 significance level to test the claim that the return rate is less than 20%. Use the P-value method and use the normal distribution as an approximation to the binomial distribution Identify the null hypothesis and alternative hypothesis OA. Ho:p<02 H:p0.2...
A college entrance exam company determined that a score of 22 on the mathematics portion of...
A college entrance exam company determined that a score of 22 on the mathematics portion of the exam suggests that a student is ready for college-level mathematics. To achieve this goal, the company recommends that students take a core curriculum of math courses in high school. Suppose a random sample of 250 students who completed this core set of courses results in a mean math score of 22.5 on the college entrance exam with a standard deviation of 3.9. Use...
Question Help In a study of cell phone usage and brain hemispheric dominance, an Internet survey...
 Question Help In a study of cell phone usage and brain hemispheric dominance, an Internet survey was e-mailed to 6970 subjects randomly selected from an online group involved with ears. There were 1315 surveys returned. Use a 0.01 significance level to test the claim that the return rate is less than 20%. Use the P-value method and use the normal distribution as an approximation to the binomial distribution. Identify the null hypothesis and alternative hypothesis. O A. Ho:p<0.2 H: p=0.2...
Question Help A college entrance exam company determined that a score of 21 on the mathematics...
 Question Help A college entrance exam company determined that a score of 21 on the mathematics portion of the exam suggests that a student is ready for college-level mathematics. To achieve this goal, the company recommends that students take a core curriculum of math courses in high school. Suppose a random sample of 250 students who completed this core set of courses results in a mean math score of 21.6 on the college entrance excam with a standard deviation of...
Can a pretest on mathematics skills predict success in a statistics course? The 82 students in an...
Can a pretest on mathematics skills predict success in a statistics course? The 82 students in an introductory statistics class took a pretest at the beginning of the semester. The least-squares regression line for predicting the score y on the final exam from the pretest score x was ŷ = 9.8 + 0.74x. The standard error of b1 was 0.41. (a) Test the null hypothesis that there is no linear relationship between the pretest score and the score on the...
Can a pretest on mathematics skills predict success in a statistics course? The 82 students in...
Can a pretest on mathematics skills predict success in a statistics course? The 82 students in an introductory statistics class took a pretest at the beginning of the semester. The least-squares regression line for predicting the score y on the final exam from the pretest score x was ŷ = 9.4 + 0.78x. The standard error of b1 was 0.44. (a) Test the null hypothesis that there is no linear relationship between the pretest score and the score on the...
For the folowing claim, find the null and alternative hypotheses, test statistic, critical value, and draw...
 For the folowing claim, find the null and alternative hypotheses, test statistic, critical value, and draw a conclusion. Assume that a simple random sample has been selected from a normally distributed population. Answer parts a-d. Claim: The mean IQ score of statistics professors is less than 119. Sample data: n 11, x 117, s 14. The significance level is ?-005 Click the icon to view a table of critical t-values. a. Choose the correct null hypothesis (Ho) and altenative hypothesis...
 A business statistics professor at a college would like to develop a regression model to predict the final exam scores for students based on their current GPS, the number of hours they studied for the exam and the number of times they were absent during the semester. The data for these variables are in the accompanying table Complete parts a through d below. ERE Click the icon to view the table of data a. Constructa regression models independent variables. Let...
 please indicate all answers
In a study of cell phone usage and brain hemispheric dominance, an Internet survey was e-maled to 6983 subjects randomly selected from an online group involved with ears. There were 1309 surveys returned. Use a 0.01 significance level to test the claim that the return rate is less than 20%. Use the P-value method and use the normal distribution as an approximation to the binomial distribution Identify the null hypothesis and alternative hypothesis OA. Ho:p<02 H:p0.2...
please indicate all answers
In a study of cell phone usage and brain hemispheric dominance, an Internet survey was e-maled to 6983 subjects randomly selected from an online group involved with ears. There were 1309 surveys returned. Use a 0.01 significance level to test the claim that the return rate is less than 20%. Use the P-value method and use the normal distribution as an approximation to the binomial distribution Identify the null hypothesis and alternative hypothesis OA. Ho:p<02 H:p0.2...
 Question Help In a study of cell phone usage and brain hemispheric dominance, an Internet survey was e-mailed to 6970 subjects randomly selected from an online group involved with ears. There were 1315 surveys returned. Use a 0.01 significance level to test the claim that the return rate is less than 20%. Use the P-value method and use the normal distribution as an approximation to the binomial distribution. Identify the null hypothesis and alternative hypothesis. O A. Ho:p<0.2 H: p=0.2...
 Question Help A college entrance exam company determined that a score of 21 on the mathematics portion of the exam suggests that a student is ready for college-level mathematics. To achieve this goal, the company recommends that students take a core curriculum of math courses in high school. Suppose a random sample of 250 students who completed this core set of courses results in a mean math score of 21.6 on the college entrance excam with a standard deviation of...
 For the folowing claim, find the null and alternative hypotheses, test statistic, critical value, and draw a conclusion. Assume that a simple random sample has been selected from a normally distributed population. Answer parts a-d. Claim: The mean IQ score of statistics professors is less than 119. Sample data: n 11, x 117, s 14. The significance level is ?-005 Click the icon to view a table of critical t-values. a. Choose the correct null hypothesis (Ho) and altenative hypothesis...
Most questions answered within 3 hours.
-
PLEASE do not use any loops for the program; only recursion is
allowed
4. Write a...
asked 15 minutes ago -
Please help me with me. I did the first part to write the operations but in...
asked 12 minutes ago -
A nozzle with a radius of 0.250 cm is attached to a garden hose
with a...
asked 6 minutes ago -
Use Cryptool to find the Cryptographic SHA-1 hash value of the
string "abc". The calculator is...
asked 16 minutes ago -
You are attempting to calculate a firm’s free cash flow to
equity. You know the following...
asked 1 hour ago -
the following reaction occurs in a balloon containing
N2O2 gas
N2O4(g)=2NO2(g)
will the volume of the...
asked 1 hour ago -
answer the questions throughout this program
public class Day implements Comparable {
Private Boolean atWork;...
asked 1 hour ago -
This is C++ code for parking fee management program
#include <iostream>
#include <iomanip>
using namespace std;...
asked 2 hours ago -
The free energy change for the following reaction at 25 °C, when
[Sn2+] = 1.17 M...
asked 3 hours ago -
An MNE is this kind of industry when competition in one country
is essentially independent of...
asked 5 hours ago -
. For this set of questions, determine what
proportion of a normal distribution is located betweeneach...
asked 5 hours ago -
A college student is employed as a door-to-door newspaper
salesman. Historical data suggests that the student...
asked 6 hours ago