
Table 6: Users' Stated Marital Preferences The Three Most Important Characteristics for a Prospective Spouse Number ofDistribution across prospective spouse's characteristics (Percentage) Occupation Education observations Appearance Personality Religion Age Others and Income Men st priority priority priority 6,334 6,334 5,991 11.02 16.47 23.21 33.71 25.51 15.31 2.01 5.00 6.96 1.97 2.78 3.95 1.36 6.7 10.82 2.65 8.31 23.21 44.57 34.13 20.35 nd rd Women 1 priority 2nd priority priorit 7,539 7,421 7,156 5.07 8.56 23.30 26.82 24.40 16.62 55.64 44.19 21.03 4.42 11.44 8.06 3.32 0.90 3.83 1.82 2.12 7.47 3.143.44 24.41 rd A Prospective Spouse's Religion that a User Avoids Number of Observations 9,458 11,052 Avoiding religiorn None 50.9 50.7 Protestant Catholic Buddhist No religion Other religions 25.0 24.1 Men Women 21.9 22.5 0.3 0.6 0.0 0.0 Prospective Spouse's Residential Area or Hometown that a User Avoids Seoul 0.12 0.29 Gveonggi 1.49 1.52 Gangwon Chungcheong Jeolla Gyeongsang Jeju and Others None 62.21 63.80 2.03 0.98 1.27 0.73 Men Women 0.26 0.13 0.23 0.16 32.39 32.39
Homework Answers
Solution
Xi as defined in the question, is dichotomous taking values 0 or 1. So, it has Bernoulli distribution. …… (1)
Then, X ~ B(n, p), ………………………………………………………………………………………………….(2)
where n = number of individuals in the sample and p is estimated by the sample proportion, say pcap
Back-up Theory
If X ~ B(n, p). i.e., X has Binomial Distribution with parameters n and p, where n = number of trials
and p = probability of one success, then, probability mass function (pmf) of X is given by
p(x) = P(X = x) = (nCx)(px)(1 - p)n – x, x = 0, 1, 2, ……. , n ……………………………………..………..(3)
[This probability can also be directly obtained using Excel Function: Statistical, BINOMDIST……….(3a)
Mean (average) of X = E(X) = µ = np……………………..………………………….....…………………..(4)
Variance of X = V(X) = σ2 = np(1 – p)………………………………………………....………….………..(5)
Standard Deviation of X = SD(X) = σ = √{np(1 – p)} ………………………………...…………………...(6)
If X ~ B(n, p), np ≥ 10 and np(1 - p) ≥ 10, then Binomial probability can be approximated by Standard Normal probabilities by Z = (X – np)/√{np(1 - p)} ~ N(0, 1) …………………………………..(7)
Or, equivalently, if pcap = sample proportion, then, Z = (pcap – p)/√{p(1 - p)/n} ~ N(0, 1) ……….…..(7a)
Given X ~ B(n, p),
100(1 - α) % Confidence Interval for the mean of X is: npcap ± MoE, ..………………………….……. (8)
where
MoE = Zα/2[SE(X)] ………………………………….....………………………………………….………..(8a)
With Zα/2 = upper (α/2)% point of N(0, 1),
Now, to work out the solution,
Part (a)
Men
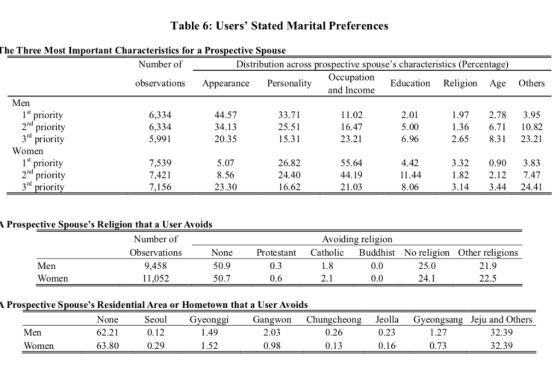
From the given Table – 6, n = 6334 and pcap = 0.4557.
So, vide (4), sample mean = 6334 x 0.4557 = 2886.4038 Answer 1
Women
From given Table – 6, n = 7539 and pcap = 0.0507.
So, vide (4), sample mean = 7539 x 0.0507 = 382.2273 Answer 2
Part (b)
Vide (5),
variance for Men is: 6334 x 0.4557 x 0.5443 = 1571.0696 Answer 3
variance for Women is: 7539 x 0.0507 x 0.9493 = 362.8484 Answer 4
Part (c)
Standard error = sqrt(Variance)
SE for Men = 39.64 Answer 5
SE for Women = 19.05 Answer 6
Part (d)
Vide (7), both np and np(1 - p) are greater than 10 for both men and women. Hence, asymptotic approach is reasonable for all further derivations. Answer 7
Part (e)
Vide (8a), MoE for Men = 1.645 x 39.64 = 65.21
So, 90% confidence interval for Men is: 2886.40 ± 65.21
= [2821.19, 2951.61] Answer 8
Part (e)
Vide (8a), MoE for Women = 1.645 x 19.05 = 31.33
So, 90% confidence interval for Women is: 382.23 ± 31.33
= [350.90, 413.56] Answer 9
DONE
Add Answer to:
2. Table 6, "Users' Stated Marital Preferences," is taken from "Preferences and Choice Constraints in Martial Sorting: Evidence from Korea," by Soohyung Lee. This data is from use...
QUESTION 5 Suppose that a researcher, using wage data on 250 randomly selected male workers and 2...
 QUESTION 5 Suppose that a researcher, using wage data on 250 randomly selected male workers and 280 female workers, estimates the OLS regression: Wage 12.52 + 2.12 x Male, R2 0.06, SER 4.2 (0.23) (0.36) where Wage is measured in dollars per hour and Male is a binary variable that is equal to 1 if the person is a male and O if the person is a female. Define the wage gender gap as the difference in the mean earnings...
4. The following table contains the wages and gender for 6 emplovees at company X. female name Cl...
 Only part e) please
4. The following table contains the wages and gender for 6 emplovees at company X. female name Claire Matt Bruce Susan Tom Jennifer wage 14 18 0 16 0 a) Compute the sample mean, variance and standard deviation of wages. b) Compute the mean of the variable female. [Side note: notice that the mean of a dummy variable is equal to the share of observations for whom the variable equals 1.] c) Express the following statements...
Only part e) please
4. The following table contains the wages and gender for 6 emplovees at company X. female name Claire Matt Bruce Susan Tom Jennifer wage 14 18 0 16 0 a) Compute the sample mean, variance and standard deviation of wages. b) Compute the mean of the variable female. [Side note: notice that the mean of a dummy variable is equal to the share of observations for whom the variable equals 1.] c) Express the following statements...
 QUESTION 5 Suppose that a researcher, using wage data on 250 randomly selected male workers and 280 female workers, estimates the OLS regression: Wage 12.52 + 2.12 x Male, R2 0.06, SER 4.2 (0.23) (0.36) where Wage is measured in dollars per hour and Male is a binary variable that is equal to 1 if the person is a male and O if the person is a female. Define the wage gender gap as the difference in the mean earnings...
 Only part e) please
4. The following table contains the wages and gender for 6 emplovees at company X. female name Claire Matt Bruce Susan Tom Jennifer wage 14 18 0 16 0 a) Compute the sample mean, variance and standard deviation of wages. b) Compute the mean of the variable female. [Side note: notice that the mean of a dummy variable is equal to the share of observations for whom the variable equals 1.] c) Express the following statements...
Only part e) please
4. The following table contains the wages and gender for 6 emplovees at company X. female name Claire Matt Bruce Susan Tom Jennifer wage 14 18 0 16 0 a) Compute the sample mean, variance and standard deviation of wages. b) Compute the mean of the variable female. [Side note: notice that the mean of a dummy variable is equal to the share of observations for whom the variable equals 1.] c) Express the following statements...
Most questions answered within 3 hours.
-
A runaway train car that has a mass of 1.71e+4 kg travels at a
speed of...
asked 36 seconds ago -
Q23 Suppose H0 is left-tailed and tTest = -2.26. (Note tTest not
zTest). The tTest value...
asked 1 minute ago -
On November 3, the spot price for cotton was $0.81/lb., and the
February futures price was...
asked 6 minutes ago -
Lincoln, Inc., which uses a volume-based cost system, produces
cat condos that sell for $170 each....
asked 5 minutes ago -
Using Python:
A Prime number is an integer greater than 1 that cannot be
formed by...
asked 28 minutes ago -
Read about Cokes strategy in Africa in the article below and
discuss the ethics of selling...
asked 15 minutes ago -
What made of a 40.0% NaOH solution should be diluted to 1.00 L
with water to...
asked 15 minutes ago -
Draw and describe the results of the Meselson-Stahl experiments
showing that DNA replication followed the Semi-conservative...
asked 20 minutes ago -
Deeply Explain the Following Web Development Softwares Along
With the Reasons to Choose them For Development....
asked 18 minutes ago -
essay question: why was Hurricane Katrina so devastating? How
and why did the levees break in...
asked 22 minutes ago -
Why might it be necessary to reduce consumer spending in order
to attain faster economic growth?...
asked 31 minutes ago -
Express your answer with the appropriate units.
1. How many milliliters of oxygen gas at STP...
asked 37 minutes ago