
17. What hypotheses would you use to test your claim? a) Ho : PA = PNA versus H.-Pa > PNA where PA = proportion of students coming from an Aggie family whose car color is maroon and pNA proportion of students who do not come from an Aggie family whose car color is maroon. b) Ho PA PNA versus H. Pa PNA where pproportion of students coming from an Aggie family whose car color is maroon and PNA proportion of students who do not come from an Aggie family whose car color is maroon. e Ho PMP versus Ha PM PNM where pM proportion of students whose car color is maroon that come from a Aggie family and pNM proportion of students whose car color is not maroon that come from a Aggie family d) H) : рм-wil versus Ha : Pa, PNM where pal proportion of students coming from an Aggie family whose car color is maroon and pNMproportion of students coming from an Aggie family whose car color is not maroon. e) Exactly two of the above are correct. 18. What p-value shonld the researchers use? a) 0.0240 b) 0.0309 c) 0.0312 d) 0.0416 e) The conditions arent met by the chi-squared test so the p-value is not valid 19 Compute the relative risk of having a maroon car between students coming from an Aggie family compared to students who dont come from an Aggie family. a) 0134 b) 086 1.17 d) 3.27 e) 418 20. Suppose the relative risk above were 2.8 (this is not coect). Interpret what this means in the context of the situation a) Students from an Aggie family are 2.8 times as likely to own a maroon car as thoee who do not come from an Aggie family car as those who come from an Aggie family who do not come from an Aggie family than those who come from an Aggie family those who come from an Aggie family b) Students who do not come from an Aggie family are 2.8 times as likely to own a maroon e) Students from an Aggie family are 2.8 times less likely to own a maroon car than thoee d) Students who come from an Aggie family are 28% more likely to own a maroon car e) Students who come from an Aggie family are 28% as likely to own a maroon car as End group of related questions.j
Homework Answers
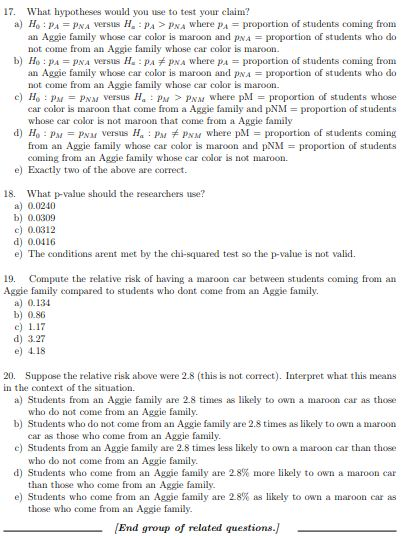
17.
Answer: Option A
Hypothesis that would be used to test the claim
- H_{0}:p_{A} = p_{NA} versus H_{a}:p_{A} > p_{NA}
18.
Answer: Option A
0.0240 is the p-value that researchers should use
19.
Answer: Option D
Relative Risk = (7/36)/(5/84) = 3.27
20.
Answer: Option A
Students from an Aggie family are 2.8 times as likely to own a maroon car as those who do not come from an Aggie family
Add Answer to:
Use the following information to answer the next 4 questions./ Several semesters ago, a group of students took an SRS from the class roster, and asked each subject two questions: whether or not they...
photos for each question are all in a row (1 point) In the following questions, use...
 photos for each question are all in a row
(1 point) In the following questions, use the normal distribution to find a confidence interval for a difference in proportions pu - P2 given the relevant sample results. Give the best point estimate for p. - P2, the margin of error, and the confidence interval. Assume the results come from random samples. Give your answers to 4 decimal places. 300. Use 1. A 80% interval for pı - P2 given that...
photos for each question are all in a row
(1 point) In the following questions, use the normal distribution to find a confidence interval for a difference in proportions pu - P2 given the relevant sample results. Give the best point estimate for p. - P2, the margin of error, and the confidence interval. Assume the results come from random samples. Give your answers to 4 decimal places. 300. Use 1. A 80% interval for pı - P2 given that...
Most questions answered within 3 hours.
-
You are attempting to calculate a firm’s free cash flow to
equity. You know the following...
asked 17 minutes ago -
the following reaction occurs in a balloon containing
N2O2 gas
N2O4(g)=2NO2(g)
will the volume of the...
asked 52 minutes ago -
answer the questions throughout this program
public class Day implements Comparable {
Private Boolean atWork;...
asked 1 hour ago -
This is C++ code for parking fee management program
#include <iostream>
#include <iomanip>
using namespace std;...
asked 1 hour ago -
The free energy change for the following reaction at 25 °C, when
[Sn2+] = 1.17 M...
asked 2 hours ago -
An MNE is this kind of industry when competition in one country
is essentially independent of...
asked 4 hours ago -
. For this set of questions, determine what
proportion of a normal distribution is located betweeneach...
asked 5 hours ago -
A college student is employed as a door-to-door newspaper
salesman. Historical data suggests that the student...
asked 5 hours ago -
MATLAB HW 11 problem using Switch Case and Input commands
Write a script file that calculates...
asked 5 hours ago -
Considering gravitational time dilation, calculate the time that
passes in Earth’s surface while 1 hour passes...
asked 6 hours ago -
Minitab Problem: Take the Lake Hume June rainfall data and find
use the processes outlined in...
asked 7 hours ago -
X Company is trying to decide whether to continue using old
equipment to make Product A...
asked 7 hours ago