
![Prob. 5 (cont.) (b) Let zln] = uln] and h[n]-G)nuln] + (-)) hnnDetermine vinl -h) rin) for -00n< oo using graphical convolut](http://img.homeworklib.com/images/24289cba-8acd-44a6-8efe-ff305771a9fc.png?x-oss-process=image/resize,w_560)
Homework Answers


Add Answer to:
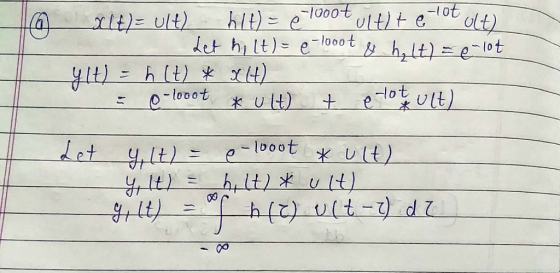
Prob. 5 (a) Let x(t) = u(t) and h(t) = e-looor u(t) + e-lotu(t). -00 <t< oo using graphical convolution(s). Determine y(t) = h(t) * x(t) for Prob. 5 (cont.) (b) Let zln] = uln] and h[n]-G)...
Prove the following: Using Convolution, determine y(t) when x(t) = 4u(t) and h(t) = e-2t u(t)...
Prove the following: Using Convolution, determine y(t) when x(t) = 4u(t) and h(t) = e-2t u(t) for t > 0 answer: y(t) = 2[1-e-2t]
x(t) = u(t)-u(t-2) w(t) = 2[u(t-1) - u(t-4)] Graphical approach of using convolution. y(t) = x(t)...
x(t) = u(t)-u(t-2) w(t) = 2[u(t-1) - u(t-4)] Graphical approach of using convolution. y(t) = x(t) * w(t) Please help, I'm kind of lost on getting the integrals and the final answer should look like a trapezoid.
Question # 4 Let x(t) u(t) be a signal, let h(t) = e -5tu(t) be a...
 Question # 4 Let x(t) u(t) be a signal, let h(t) = e -5tu(t) be a linear time invariant system (a) Sketch x(t) and h(t) (b) Find the mathematival expression of output of the system y(t) by using convolution. (c) Sketch y(t)
2(a). Compute and plot the convolution of ytryh)x where h(t) t)-u(t-4), x(t)u(t)-u(t-1) and zero else b)....
 2(a). Compute and plot the convolution of ytryh)x where h(t) t)-u(t-4), x(t)u(t)-u(t-1) and zero else b). Compute and plot the convolution y(n) h(n)*x (n) where h(n)-1, for 0Sns4, x(n) 1, n 0, 1 and zero else.
1. Let x(t)-u(t-1) _ u(t-3) + δ(t-2) and h(t)-u(t) _ u(t-1) + u(t-3)-u(t-5) a. Find and...
 1. Let x(t)-u(t-1) _ u(t-3) + δ(t-2) and h(t)-u(t) _ u(t-1) + u(t-3)-u(t-5) a. Find and sketch x(t-t) and h(t). (Hint: Break x(t) into two signals) b. Find and sketch y(t) - x(t)*h(t) using the quasi-graphical method. Label and show every step (drawings and calculations)
2. Let f(x,y) = e-r-u, 0 < x < oo, 0 < y < oo, zero...
 2. Let f(x,y) = e-r-u, 0 < x < oo, 0 < y < oo, zero elsewhere, be the pdf of X and Y. Then if Z = X + Y, compute (a) P(Z 0). (b) P(Z 6) (c) P(Z 2) (d) What is the pdf of Z?
1. Problem 1: (20 pts) Let 3(t) = u(1 – t) and h(t) = tſu(t) -...
 1. Problem 1: (20 pts) Let 3(t) = u(1 – t) and h(t) = tſu(t) - t - 2)). (a) Sketch h(t), 3(1), 2(t - T) and carefully label the values on the axes. (6 pts) (b) Determine y(t) = 3(t)h(t) by performing graphical convolution. No need to sketch y(t). (14 pts)
Problem: Let x[n] = δ[n] + 2δ[n-1] - δ[n-2] and h[n] = u[n] – u[n-4] –...
Problem: Let x[n] = δ[n] + 2δ[n-1] - δ[n-2] and h[n] = u[n] – u[n-4] – 2.δ[n-1]. Compute and plot the following convolutions. If you use the analytical form of the convolution equation to solve, verify your answer with the graphical method. a. y1[n] = x[n]*h[n] b. y2[n] = x[n]*h[n+1] c. y3[n] = x[n-1]*h[n]
Q2 (a) Given the signal x(t) and system h(t) as presented in Figure Q2(a). Determine the...
 Q2 (a) Given the signal x(t) and system h(t) as presented in Figure Q2(a). Determine the output y(t) using the graphical representation of convolution integral. (7 marks) x(1) h(t) 1 e-'u(t) e-2 (1) 0 Figure Q2(a) Q2 (b) Consider a system as shown in Figure Q2(b). t2 - 1 x(t) y(t) Advance by 1 second Х Figure Q2(b) Find the input-output relation between x(t) and y(t). (i) (1 mark) Examine whether the system is time variant or time invariant. (5...
By using convolution theorem, not laplace. !!!!!!! Determine the output y(t) for the following pairs of...
 By using convolution
theorem, not laplace. !!!!!!!
Determine the output y(t) for the following pairs of input signals x(t) and impulse responses h(t): (i) x(t)=u(t), h(t)=u(t): (iii) x(1) 11(1) _ 211(-1) + 11( -2), h(1) 11( 1) _ 11(-1);
By using convolution
theorem, not laplace. !!!!!!!
Determine the output y(t) for the following pairs of input signals x(t) and impulse responses h(t): (i) x(t)=u(t), h(t)=u(t): (iii) x(1) 11(1) _ 211(-1) + 11( -2), h(1) 11( 1) _ 11(-1);
 Question # 4 Let x(t) u(t) be a signal, let h(t) = e -5tu(t) be a linear time invariant system (a) Sketch x(t) and h(t) (b) Find the mathematival expression of output of the system y(t) by using convolution. (c) Sketch y(t)
 2(a). Compute and plot the convolution of ytryh)x where h(t) t)-u(t-4), x(t)u(t)-u(t-1) and zero else b). Compute and plot the convolution y(n) h(n)*x (n) where h(n)-1, for 0Sns4, x(n) 1, n 0, 1 and zero else.
 1. Let x(t)-u(t-1) _ u(t-3) + δ(t-2) and h(t)-u(t) _ u(t-1) + u(t-3)-u(t-5) a. Find and sketch x(t-t) and h(t). (Hint: Break x(t) into two signals) b. Find and sketch y(t) - x(t)*h(t) using the quasi-graphical method. Label and show every step (drawings and calculations)
 2. Let f(x,y) = e-r-u, 0 < x < oo, 0 < y < oo, zero elsewhere, be the pdf of X and Y. Then if Z = X + Y, compute (a) P(Z 0). (b) P(Z 6) (c) P(Z 2) (d) What is the pdf of Z?
 1. Problem 1: (20 pts) Let 3(t) = u(1 – t) and h(t) = tſu(t) - t - 2)). (a) Sketch h(t), 3(1), 2(t - T) and carefully label the values on the axes. (6 pts) (b) Determine y(t) = 3(t)h(t) by performing graphical convolution. No need to sketch y(t). (14 pts)
 Q2 (a) Given the signal x(t) and system h(t) as presented in Figure Q2(a). Determine the output y(t) using the graphical representation of convolution integral. (7 marks) x(1) h(t) 1 e-'u(t) e-2 (1) 0 Figure Q2(a) Q2 (b) Consider a system as shown in Figure Q2(b). t2 - 1 x(t) y(t) Advance by 1 second Х Figure Q2(b) Find the input-output relation between x(t) and y(t). (i) (1 mark) Examine whether the system is time variant or time invariant. (5...
 By using convolution
theorem, not laplace. !!!!!!!
Determine the output y(t) for the following pairs of input signals x(t) and impulse responses h(t): (i) x(t)=u(t), h(t)=u(t): (iii) x(1) 11(1) _ 211(-1) + 11( -2), h(1) 11( 1) _ 11(-1);
By using convolution
theorem, not laplace. !!!!!!!
Determine the output y(t) for the following pairs of input signals x(t) and impulse responses h(t): (i) x(t)=u(t), h(t)=u(t): (iii) x(1) 11(1) _ 211(-1) + 11( -2), h(1) 11( 1) _ 11(-1);
Most questions answered within 3 hours.
-
1.How large must the coefficient of static friction be between
the tires and the road if...
asked 11 minutes ago -
What is the time complexity (Big-O) of the following code?
class Main
{
// Recursive...
asked 10 minutes ago -
Economists look at any situation in terms of its component
parts: the people making decisions, the...
asked 16 minutes ago -
What is a population?
Select one:
a. All of the individual organisms belonging to the same...
asked 20 minutes ago -
You have a yeast cell culture with a concentration of 5x10^4
cells/ml. If you dilute this...
asked 25 minutes ago -
In which direction the Reaction goes? Show detailed process.
SeO3 + 2ClO2. + 2H3O <---> Se...
asked 38 minutes ago -
Unexposed silver halides are removed from photographic film when
they react with sodium thiosulfate
(Na2S2O3, called...
asked 38 minutes ago -
A 0.3054 gram sample of the mineral chalcopyrite (CuFeS2)
yielded 0.6525 gram BaSO4 precipitate. What is...
asked 38 minutes ago -
An short-seller in Tesla is worried the latest management
earnings forecast is too aggressive and the...
asked 1 hour ago -
Question 3 (1 point)
Fill in the blank. Speed Car Rental company found that the tire...
asked 1 hour ago -
1. A copper wire is 26.61 cm long and weighs 1.265 g. The
density of copper...
asked 1 hour ago -
Remember that a concept sketch consists of a sketch (or
series of sketches), labels, and complete...
asked 1 hour ago