
Homework Answers
Add Answer to:
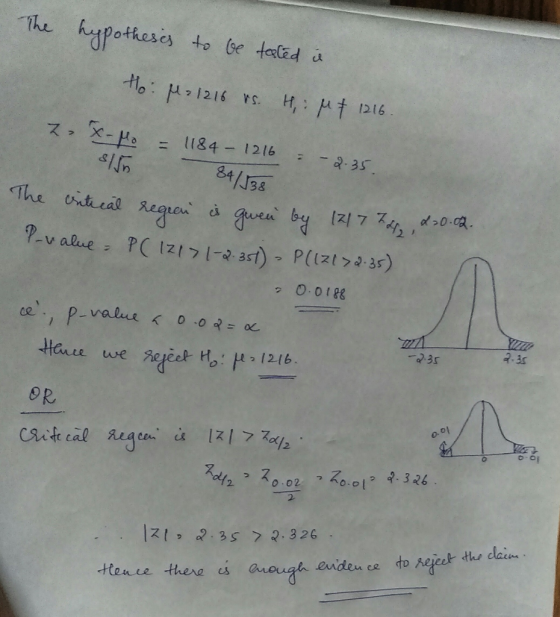
Test the claim that μ- s-8.4 12 16, given that e-0.02 and the sample statistics are "-3S,7-1184, and A. standardized test statistic s -2.35, critical value- 2.326, reject Ho: There is enough...
Use a t-test to test the claim about the population mean μ at the given level...
 Use a t-test to test the claim about the population mean μ at the given level of significance α using the given sample statistics. Assume the population is normally distributed. Claim: μ# 25; α:0.05 Sample statistics: x 29.9, s-44, n 11 What is the value of the standardized test statistic? The standardized test statistic is(Round to two decimal places as needed.) What is the P-value of the test statistic? P-value (Round to three decimal places as needed.) Decide whether to...
Use a t-test to test the claim about the population mean μ at the given level...
 Use a t-test to test the claim about the population mean μ at the given level of significance α using the given sample statistics. Assume the population is normally distributed. Claim: μ z 8300; α= 0.10 Sample statistics: x= 8100, s= 470, n= 22 18. What are the null and alternative hypotheses? ○ A. H0:1128300 O c. Ho: μ#8300 O B. Ho: μ#8300 Ha: μ = 8300 D. Ho: μ 8300 Ha: μ > 8300 Ha: μ < 8300 Ha:...
Test the claim about the population mean, μ, at the given level of significance using the...
 Test the claim about the population mean, μ, at the given level of significance using the given sample statistics Claim: -30: -0.04; ơ: 3.92. Sample statistics: x-28.5, n-64 Identify the null and alternative hypotheses. Choose the correct answer below B. Ho:H> 30 Ha: H 30 D. Ho : < 30 Ha: H<30 #30 Ha : НО. Е, 30 Ha H> 30 Calculate the standardized test statistic. The standardized test statistic is (Round to two decimal places as needed.) Determine the...
Test the claim about the population mean, μ' atte gven level of signfcance using the given sample...
 Test the claim about the population mean, μ' atte gven level of signfcance using the given sample statistics. Cairn: μ-30: α-002; σ-321 Sample statistics: x-28.6, n.54 dentify the null and aibernative hypotheses. Choose the comect answer below He's .30 Ha : μ > 30 Caloulate the standardized test statistic. The standardized test statistic is Round to two decimal places as needed.) Determine the ortical value(o) Select the correct choice below and i in the anawer box to complete your choice...
Use technology to help you test the claim about the population mean, μ, at the given...
 Use technology to help you test the claim about the population mean, μ, at the given level of significance, α, using the given sample statistics. Assume the population is normally distributed. Claim: μ> 1 180: α 0.02; σ 211.79. Sample statistics: x 1203.69, n 250 ldentify the null and alternative hypotheses. Choose the correct answer below ) B. H0: μ s 1180 Ha : μ> 1180 Ha: μ 1203.69 HH 1180 Ha H 1180 O c. HOHs 1203 D. Ho...
4 ח Test the claim about the population mean, i, at the given level of significance...
 4
ח Test the claim about the population mean, i, at the given level of significance using the given sample statistics. Claim: = 30; a =0.04; 0 = 3.52. Sample statistics: X = 292, n=53 Identify the null and alternative hypotheses. Choose the correct answer below. O A. Ho u = 30 He: > 30 oc. Họ H= 30 H< 30 OE. HO = 30 Hy #30 OB. Ho * 30 H = 30 OD. H: > 30 H, =...
4
ח Test the claim about the population mean, i, at the given level of significance using the given sample statistics. Claim: = 30; a =0.04; 0 = 3.52. Sample statistics: X = 292, n=53 Identify the null and alternative hypotheses. Choose the correct answer below. O A. Ho u = 30 He: > 30 oc. Họ H= 30 H< 30 OE. HO = 30 Hy #30 OB. Ho * 30 H = 30 OD. H: > 30 H, =...
distributed Use a t-test to test the claim about the population mean ji at the given...
 distributed Use a t-test to test the claim about the population mean ji at the given level of significance a using the given sample statistics. Assume the population is normally Claim: #26; a=0.10 Sample statistics: X = 26.5, s=4.3, n = 11 What are the null and alternative hypotheses? Choose the correct answer below O A. Ho +26 OB. Ho: 226 H, = 26 H <26 OCH p=26 OD. HY S 26 H, #26 H>26 What is the value of...
just the answer is fine Use technology and a t-test to test the claim about the...
 just the answer is fine
Use technology and a t-test to test the claim about the population means at the given level of significance or using the given sample statistics. Assume the population is normally distributed. Claim: > 80; a = 0.10 Sample statistics: x=82.5, S = 2.9, n=25 O A. Hou#80 HA 80 C. H: 580 Hu> 80 OB. H: 280 H: <80 OD. H: 80 HA: #80 What is the value of the standardized test statistic? The standardized...
just the answer is fine
Use technology and a t-test to test the claim about the population means at the given level of significance or using the given sample statistics. Assume the population is normally distributed. Claim: > 80; a = 0.10 Sample statistics: x=82.5, S = 2.9, n=25 O A. Hou#80 HA 80 C. H: 580 Hu> 80 OB. H: 280 H: <80 OD. H: 80 HA: #80 What is the value of the standardized test statistic? The standardized...
Determine the outcome and conclusion of the test. Choose from the following. O A. Reject Ho....
 Determine the outcome and conclusion of the test. Choose from the following. O A. Reject Ho. At the 6% significance level, there is enough evidence to reject the claim. OB. Fail to reject Ho. At the 6% significance level, there is not enough evidence to support the claim. O C. Reject Ho. At the 6% significance level, there is enough evidence to support the claim. D. Fail to reject Ho. At the 6% significance level, there is not enough evidence...
Test the claim about the population mean, H. at the given level of significance using the...
 Test the claim about the population mean, H. at the given level of significance using the given sample statistics. Claim: u = 40; a=0.01; 6 = 3.56. Sample statistics: x = 38.7, n= 76 Identify the null and alternative hypotheses. Choose the correct answer below. O A. Ho: = 40 Ha <40 O C. Ho: u = 40 Ha: #40 O E. Ho: #40 Ha: p= 40 OB. Ho: < 40 H: H = 40 OD. Ho: > 40 Ha...
 Use a t-test to test the claim about the population mean μ at the given level of significance α using the given sample statistics. Assume the population is normally distributed. Claim: μ# 25; α:0.05 Sample statistics: x 29.9, s-44, n 11 What is the value of the standardized test statistic? The standardized test statistic is(Round to two decimal places as needed.) What is the P-value of the test statistic? P-value (Round to three decimal places as needed.) Decide whether to...
 Use a t-test to test the claim about the population mean μ at the given level of significance α using the given sample statistics. Assume the population is normally distributed. Claim: μ z 8300; α= 0.10 Sample statistics: x= 8100, s= 470, n= 22 18. What are the null and alternative hypotheses? ○ A. H0:1128300 O c. Ho: μ#8300 O B. Ho: μ#8300 Ha: μ = 8300 D. Ho: μ 8300 Ha: μ > 8300 Ha: μ < 8300 Ha:...
 Test the claim about the population mean, μ, at the given level of significance using the given sample statistics Claim: -30: -0.04; ơ: 3.92. Sample statistics: x-28.5, n-64 Identify the null and alternative hypotheses. Choose the correct answer below B. Ho:H> 30 Ha: H 30 D. Ho : < 30 Ha: H<30 #30 Ha : НО. Е, 30 Ha H> 30 Calculate the standardized test statistic. The standardized test statistic is (Round to two decimal places as needed.) Determine the...
 Test the claim about the population mean, μ' atte gven level of signfcance using the given sample statistics. Cairn: μ-30: α-002; σ-321 Sample statistics: x-28.6, n.54 dentify the null and aibernative hypotheses. Choose the comect answer below He's .30 Ha : μ > 30 Caloulate the standardized test statistic. The standardized test statistic is Round to two decimal places as needed.) Determine the ortical value(o) Select the correct choice below and i in the anawer box to complete your choice...
 Use technology to help you test the claim about the population mean, μ, at the given level of significance, α, using the given sample statistics. Assume the population is normally distributed. Claim: μ> 1 180: α 0.02; σ 211.79. Sample statistics: x 1203.69, n 250 ldentify the null and alternative hypotheses. Choose the correct answer below ) B. H0: μ s 1180 Ha : μ> 1180 Ha: μ 1203.69 HH 1180 Ha H 1180 O c. HOHs 1203 D. Ho...
 4
ח Test the claim about the population mean, i, at the given level of significance using the given sample statistics. Claim: = 30; a =0.04; 0 = 3.52. Sample statistics: X = 292, n=53 Identify the null and alternative hypotheses. Choose the correct answer below. O A. Ho u = 30 He: > 30 oc. Họ H= 30 H< 30 OE. HO = 30 Hy #30 OB. Ho * 30 H = 30 OD. H: > 30 H, =...
4
ח Test the claim about the population mean, i, at the given level of significance using the given sample statistics. Claim: = 30; a =0.04; 0 = 3.52. Sample statistics: X = 292, n=53 Identify the null and alternative hypotheses. Choose the correct answer below. O A. Ho u = 30 He: > 30 oc. Họ H= 30 H< 30 OE. HO = 30 Hy #30 OB. Ho * 30 H = 30 OD. H: > 30 H, =...
 distributed Use a t-test to test the claim about the population mean ji at the given level of significance a using the given sample statistics. Assume the population is normally Claim: #26; a=0.10 Sample statistics: X = 26.5, s=4.3, n = 11 What are the null and alternative hypotheses? Choose the correct answer below O A. Ho +26 OB. Ho: 226 H, = 26 H <26 OCH p=26 OD. HY S 26 H, #26 H>26 What is the value of...
 just the answer is fine
Use technology and a t-test to test the claim about the population means at the given level of significance or using the given sample statistics. Assume the population is normally distributed. Claim: > 80; a = 0.10 Sample statistics: x=82.5, S = 2.9, n=25 O A. Hou#80 HA 80 C. H: 580 Hu> 80 OB. H: 280 H: <80 OD. H: 80 HA: #80 What is the value of the standardized test statistic? The standardized...
just the answer is fine
Use technology and a t-test to test the claim about the population means at the given level of significance or using the given sample statistics. Assume the population is normally distributed. Claim: > 80; a = 0.10 Sample statistics: x=82.5, S = 2.9, n=25 O A. Hou#80 HA 80 C. H: 580 Hu> 80 OB. H: 280 H: <80 OD. H: 80 HA: #80 What is the value of the standardized test statistic? The standardized...
 Determine the outcome and conclusion of the test. Choose from the following. O A. Reject Ho. At the 6% significance level, there is enough evidence to reject the claim. OB. Fail to reject Ho. At the 6% significance level, there is not enough evidence to support the claim. O C. Reject Ho. At the 6% significance level, there is enough evidence to support the claim. D. Fail to reject Ho. At the 6% significance level, there is not enough evidence...
 Test the claim about the population mean, H. at the given level of significance using the given sample statistics. Claim: u = 40; a=0.01; 6 = 3.56. Sample statistics: x = 38.7, n= 76 Identify the null and alternative hypotheses. Choose the correct answer below. O A. Ho: = 40 Ha <40 O C. Ho: u = 40 Ha: #40 O E. Ho: #40 Ha: p= 40 OB. Ho: < 40 H: H = 40 OD. Ho: > 40 Ha...
Most questions answered within 3 hours.
-
Intro to Java Programming
Write a method named isDivisible that takes two integers, n
and m,...
asked 1 minute from now -
What is the main use of a transistor and what is an Integrated
Circuit?
asked 13 seconds ago -
Calculate whether loci A&B are in linkage disequilibrium
(D) using the following data. Is the haplotype...
asked 17 minutes ago -
Barrington Box Enterprises has two divisions, large and small,
that share the common costs of the...
asked 21 minutes ago -
An integer number is said to be a perfect number if it is equal
to the...
asked 33 minutes ago -
What does economies of scale often fail to measure? How would
you recommend addressing this limitation?
asked 32 minutes ago -
Joanne Quick made an investment of $18,787.14. From this
investment, she will receive $2,000 annually for...
asked 40 minutes ago -
Enter your answer in the provided box. The solubility of CO2 in
water at 25°C and...
asked 46 minutes ago -
Amazon as with other ecommerce retailers struggle with cross
border solutions and continue to be country...
asked 45 minutes ago -
A second baseman tosses the ball to the first baseman, who
catches it at the same...
asked 1 hour ago -
An object rests flat on a tablecloth, which is on top of a
table. Suppose you...
asked 1 hour ago -
Which of the following will most likely occur as the result of
an unanticipated increase in...
asked 58 minutes ago