
Homework Answers
(A)
(a)
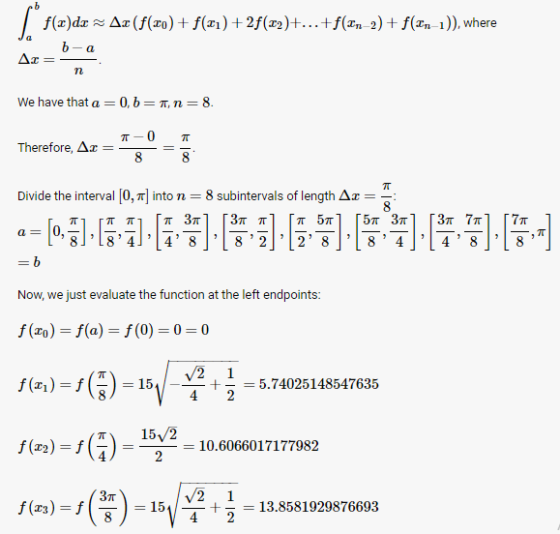
![f(z)d Az (f(zo)+f()2f (2)+.. +f()+f( where -a 0, b 4 We have that a T, n Therefore, Δχ 4 4 Divide the interval [O, π] into n](http://img.homeworklib.com/images/bbd9b9d9-6bf3-4b5d-aa6f-2a0b5fdaf1c9.png?x-oss-process=image/resize,w_560)

(b)

(B)
(a)

(b)

[Please give me a Thumbs Up if you are satisfied with my answer. If you are not, please comment on it, so I can edit the answer. Thanks.]
Add Answer to:
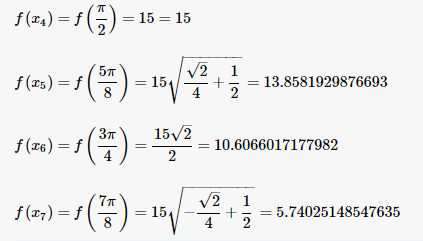
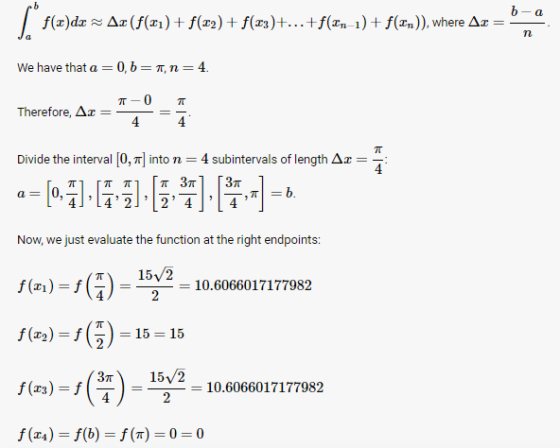
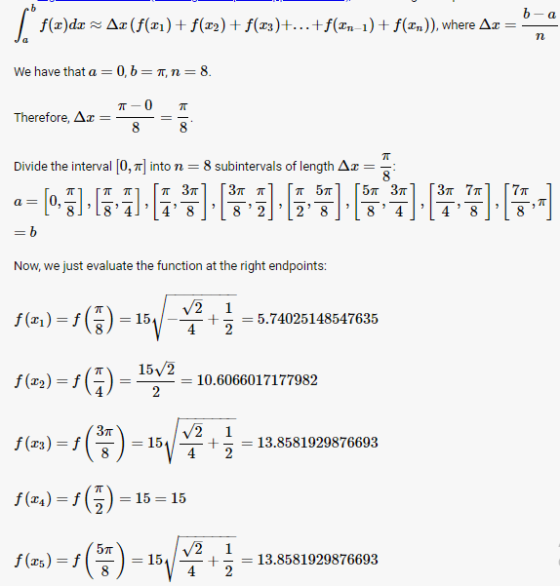
approximate the area under the graph of the function f(x)=15sinx from 0 to pi for n=4 and n=8 subitervals by using lower and upper sums rap ec vals by ysing lae nd uppec sums lowec Sums a lo uppe...
Consider the graph 12 10 6, 9) y-f(x 8 (2, 7) (4, 5) (0, 3) (8, 0) 10 (a) Using the indicated subintervals, approximate the shaded area by using lower sums s (rectangles that lie below the graph of f...
 Consider the graph 12 10 6, 9) y-f(x 8 (2, 7) (4, 5) (0, 3) (8, 0) 10 (a) Using the indicated subintervals, approximate the shaded area by using lower sums s (rectangles that lie below the graph of f) (b) Using the indicated subintervals, approximate the shaded area by using upper sums S (rectangles that extend above the graph of f) +-14 points SullivanCalc1 5.1.019 Approximate the area A under the graph of function f from a to b...
Estimate the area of the region bounded by the graph of f(x)-x + 2 and the x-axis on [0,4] in the following ways a. Divide [0,4] into n = 4 subintervals and approximate the area of the region using...
 Estimate the area of the region bounded by the graph of f(x)-x + 2 and the x-axis on [0,4] in the following ways a. Divide [0,4] into n = 4 subintervals and approximate the area of the region using a left Riemann sum. Illustrate the solution geometrically. b. Divide [0,4] into n = 4 subintervals and approximate the area of the region using a midpoint Riemann sum· illustrate the solution geometrically. C. Divide [04] into n = 4 subintervals and...
Approximate the area under the graph of f(x) and above the x-axis using n rectangles f(x)...
 Approximate the area under the graph of f(x) and above the x-axis using n rectangles f(x) = 2x + 3 from x = 0 to x = 2; n = 4; use right endpoints 17 O 15 13 11
Consider the function f: [-1,1] defined by f(x)= 1, if x<0; 2016, if x=0; 1908, if x>0 Prove that f is integrable on [-1,1] (by using partitions and upper/lower sums)
Consider the function f: [-1,1] defined by f(x)= 1, if x<0; 2016, if x=0; 1908, if x>0 Prove that f is integrable on [-1,1] (by using partitions and upper/lower sums)
Approximate the area under a curve using left-endpoint approximation Question Given the graph of the function...
 Approximate the area under a curve using left-endpoint approximation Question Given the graph of the function f(a) below, use a left Riemann sum with 4 rectangles to approximate the integral So f(x) dr. 00 7 6 5 4 3 N 1 2 3 Select the correct answer below: BI Ne
Use finite approximation to estimate the area under the graph of f(x) = x² and above...
 Use finite approximation to estimate the area under the graph of f(x) = x² and above the graph of f(x) = 0 from Xo = 0 to x = 4 using i) a lower sum with two rectangles of equal width ii) a lower sum with four rectangles of equal width ii) an upper sum with two rectangles of equal width iv) an upper sum with four rectangles of equal width The estimated area using a lower sum with two...
Use a Riemann sum to approximate the area under the graph of f(x) = x2 on...
 Use a Riemann sum to approximate the area under the graph of f(x) = x2 on the interval 25x54 using n = 5 subintervals with the selected points as the left end points. The area is approximately (Type an integer or a decimal.)
Use finite approximation to estimate the area under the graph of f(x) =x2 and above the...
 Use finite approximation to estimate the area under the graph of f(x) =x2 and above the graph of f(x) = 0 from x0-0 to xn-14 using i) a lower sum with two rectangles of equal width. ii) a lower sum with four rectangles of equal width ili) an upper sum with two rectangles of equal width iv) an upper sum with four rectangles of equal width. The estimated area using a lower sum with two rectangles of equal width is...
Use finite approximation to estimate the area under the graph of f(x) = 9x? and above...
 Use finite approximation to estimate the area under the graph of f(x) = 9x? and above the graph of f(x) = O from xo + 0 to x = 4 using i) a lower sum with two rectangles of equal width ii) a lower sum with four rectangles of equal width ii) an upper sum with two rectangles of equal width. iv) an upper sum with four rectangles of equal width. The estimated area using a lower sum with two...
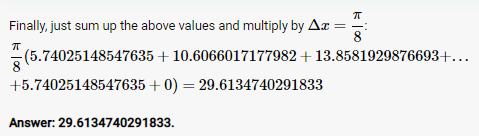
Estimate the area Upper A between the graph of the function f left-parenthesis x right-parenthesis equals 1 0 s i n x and the interval left-bracket 0 comma pi right-bracket Number . Use an approximati...
Estimate the area Upper A between the graph of the function f left-parenthesis x right-parenthesis equals 1 0 s i n x and the interval left-bracket 0 comma pi right-bracket Number . Use an approximation scheme with n equals 2 comma 5 and 10 rectangles. Use the right endpoints. If your calculating utility will perform automatic summations, estimate the specified area using n equals 50 and n equals 100 rectangles.
 Consider the graph 12 10 6, 9) y-f(x 8 (2, 7) (4, 5) (0, 3) (8, 0) 10 (a) Using the indicated subintervals, approximate the shaded area by using lower sums s (rectangles that lie below the graph of f) (b) Using the indicated subintervals, approximate the shaded area by using upper sums S (rectangles that extend above the graph of f) +-14 points SullivanCalc1 5.1.019 Approximate the area A under the graph of function f from a to b...
 Estimate the area of the region bounded by the graph of f(x)-x + 2 and the x-axis on [0,4] in the following ways a. Divide [0,4] into n = 4 subintervals and approximate the area of the region using a left Riemann sum. Illustrate the solution geometrically. b. Divide [0,4] into n = 4 subintervals and approximate the area of the region using a midpoint Riemann sum· illustrate the solution geometrically. C. Divide [04] into n = 4 subintervals and...
 Approximate the area under the graph of f(x) and above the x-axis using n rectangles f(x) = 2x + 3 from x = 0 to x = 2; n = 4; use right endpoints 17 O 15 13 11
 Approximate the area under a curve using left-endpoint approximation Question Given the graph of the function f(a) below, use a left Riemann sum with 4 rectangles to approximate the integral So f(x) dr. 00 7 6 5 4 3 N 1 2 3 Select the correct answer below: BI Ne
 Use finite approximation to estimate the area under the graph of f(x) = x² and above the graph of f(x) = 0 from Xo = 0 to x = 4 using i) a lower sum with two rectangles of equal width ii) a lower sum with four rectangles of equal width ii) an upper sum with two rectangles of equal width iv) an upper sum with four rectangles of equal width The estimated area using a lower sum with two...
 Use a Riemann sum to approximate the area under the graph of f(x) = x2 on the interval 25x54 using n = 5 subintervals with the selected points as the left end points. The area is approximately (Type an integer or a decimal.)
 Use finite approximation to estimate the area under the graph of f(x) =x2 and above the graph of f(x) = 0 from x0-0 to xn-14 using i) a lower sum with two rectangles of equal width. ii) a lower sum with four rectangles of equal width ili) an upper sum with two rectangles of equal width iv) an upper sum with four rectangles of equal width. The estimated area using a lower sum with two rectangles of equal width is...
 Use finite approximation to estimate the area under the graph of f(x) = 9x? and above the graph of f(x) = O from xo + 0 to x = 4 using i) a lower sum with two rectangles of equal width ii) a lower sum with four rectangles of equal width ii) an upper sum with two rectangles of equal width. iv) an upper sum with four rectangles of equal width. The estimated area using a lower sum with two...
Most questions answered within 3 hours.
-
1) There is a 5.0 μC charge at each of 3 corners of a square
(each...
asked 5 seconds from now -
A study of 420,095 cell phone users found that
134 of them developed cancer of the...
asked 3 minutes ago -
2.50 g of NH4Cl is added to 12.9 g of water. Calculate the
molality of the...
asked 6 minutes ago -
Part 1
(a) Calculate the pH at 25°C of a 0.10 M solution of a
weak...
asked 8 minutes ago -
1-Calculate the mass in grams of 2.55 moles of KCl
2- Calculate how many moles are...
asked 35 minutes ago -
Bright Sun, Inc. sold an issue of 30-year $1,000 par value bonds
to the public. The...
asked 30 minutes ago -
Bismuth-210 is beta emitter with a half-life of 5.0 days.
Part A
If a sample contains...
asked 22 minutes ago -
The income statement for the month of June, 2014 of Happy Smiles
Enterprises contains the following...
asked 35 minutes ago -
To be done in java code. 2 words are anagrams if 1 word can be
formed...
asked 33 minutes ago -
Two players take turns at removing 1 to 4 coins from an original
pile of 16...
asked 29 minutes ago -
1. Choose value for p between 0.20 and 0.80. It should have at
least two decimal...
asked 37 minutes ago -
QUESTIONS: 500 words for the question
In defining abnormality, the criteria of “deviance”, “distress”
and “dysfunction”...
asked 38 minutes ago