


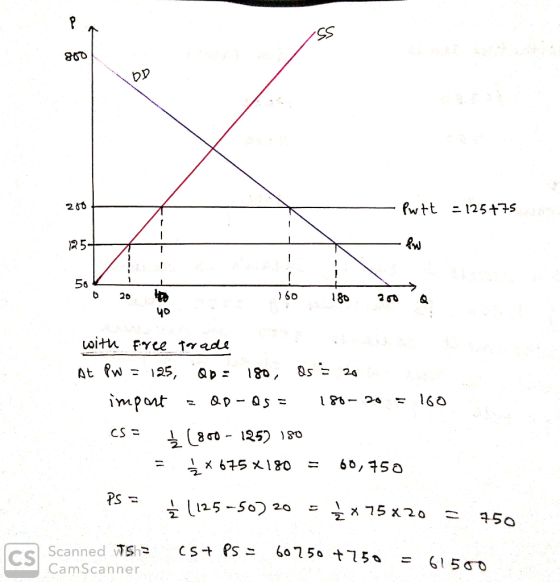
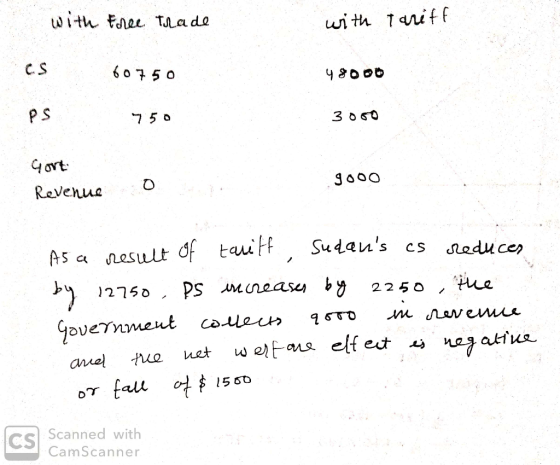
Suppose the Sudanese govemment decldes to Impose a tarlff of $75 on each ton of com. With the tariff, the domestic price of a ton of corn will be and Sudan will Import tons of con. Show the effects of the $75 tartf on the following graph. In particular, use the green triangle (trlangle symbols) to show the consumer surplus with the tarff, the purple triangle (dlamond symbols) to show the producer surplus with the tariff, and the red quadrilateral (cross symbols) to shade the area representing government revenue recelved from the tariff. Finally, use the tan triangle (dash symbols) to shade the areas representing deadweight loss (DL) caused by the tarlff. (Hint: Hover your mouse over any area you shaded to display its value In thousands of dollars.) PRICE IDollars per tonl 725 Demand 650 575 350 0 40 12160 00 Summarize your results from the two graphs by selecting the appropriate values in the following table With Tariff With Free Trade Consumer Surplus
125 0 40 80 120 160 200 Summarize your results from the two graphs by selecting the appropriate values in the following table: With Free Trade With Tariff Consumer Surplus Producer Surplus Government Revenue byproducer surplus by of Tool 1.55
Homework Answers

Add Answer to:
Suppose Sudan is a "small country" In the world market for corn. The following graph shows the demand and supply curves for the domestic market for com. The world price is $125 per ton...
Suppose Panama is open to free trade in the world market for maize. Because of Panama's small size, the demand for and supply of maize in Panama do not affect the world price.
 6. Welfare effects of a tariff in a small country Suppose Panama is open to free trade in the world market for maize. Because of Panama's small size, the demand for and supply of maize in Panama do not affect the world price. The following graph shows the domestic maize market in Panama. The world price of maize is Pw =$350 per ton. On the following graph, use the green triangle (triangle symbols) to shade the area representing consumer surplus (CS) when...
Suppose Bangladesh is open to free trade in the world market for maize. Because of Bangladesh's small size, the demand for and supply of maize in Bangladesh do not affect the world price.
 6. Welfare effects of a tariff in a small country Suppose Bangladesh is open to free trade in the world market for maize. Because of Bangladesh's small size, the demand for and supply of maize in Bangladesh do not affect the world price. The following graph shows the domestic maize market in Bangladesh. The world price of maize is Pw=$350 per ton. On the following graph, use the green triangle (triangle symbols) to shade the area representing consumer surplus (CS) when the...
Consider the Sudanese market for tangerines The following graph shows the domestic demand and domestic supply...
 Consider the Sudanese market for tangerines The following graph shows the domestic demand and domestic supply curves for tangerines in Sudan. Suppose Sudan's government currently does not allow international trade in tangerines Use the black point (plus symbol) to indicate the equilibrium price of a ton of tangerines and the equilibrium quantity of tangerines in Sudan in the absence of international trade. Then, use the green triangle (triangle symbol) to shade the area representing consumer surplus in equilibrium. Finally, use...
Suppose Kenya is open to free trade In the world market for wheat. Because of Kenya's small size, the demand for and supply of wheat In Kenya do not affect the world price.
 3. Welfare effects of a tariff In a small country Suppose Kenya is open to free trade In the world market for wheat. Because of Kenya's small size, the demand for and supply of wheat In Kenya do not affect the world price. The following graph shows the domestic wheat market In Kenya. The world price of wheat is Pw - $250 per ton. On the following graph, use the green triangle (triangle symbols) to shade the area representing consumer surplus (CS)...
Suppose Zambia is open to free trade in the world market for oranges. Because of Zambia's small size, the demand for and supply of oranges in Zambia do not affect the world price.
 3. Welfare effects of a tariff in a small country Suppose Zambia is open to free trade in the world market for oranges. Because of Zambia's small size, the demand for and supply of oranges in Zambia do not affect the world price. The following graph shows the domestic oranges market in Zambia. The world price of oranges is Pw = $800 per ton. On the following graph, use the green triangle (triangle symbols) to shade the area representing consumer surplus (CS)...
The following graph shows the domestic demand and domestic supply curves for tangerines in Sudan. Suppose Sudan's government currently does not allow international trade in tangerines.
 1. Welfare effects of free trade in an exporting country Consider the Sudanese market for tangerines. The following graph shows the domestic demand and domestic supply curves for tangerines in Sudan. Suppose Sudan's government currently does not allow international trade in tangerines. Use the black point (plus symbol) to indicate the equilibrium price of a ton of tangerines and the equilibrium quantity of tangerines in Sudan in the absence of international trade. Then, use the green triangle (triangle symbol) to shade the area...
The following graph shows the domestic demand and domestic supply curves for lemons In Bolivia.
 Consider the Bolivian market for lemons. The following graph shows the domestic demand and domestic supply curves for lemons In Bolivia. Suppose Bolivia's government currently does not allow International trade In lemons. Use the black point (plus symbol) to Indicate the equilibrium price of a ton of lemons and the equilibrium quantity of lemons in Bolivia in the absence of International trade. Then, use the green triangle (triangle symbol) to shade the area representing consumer surplus In equilibrium. Finally, use the purple...
The following graph shows the domestic demand and domestic supply curves for tangerines in Panama. Suppose...
 The following graph shows the domestic demand and domestic supply curves for tangerines in Panama. Suppose Panama's government currently does not allow international trade in tangerines. Use the black point (plus symbol) to indicate the equilibrium price of a ton of tangerines and the equilibrium quantity of tangerines in Panama in the absence of international trade. Then, use the green triangle (triangle symbol) to shade the area representing consumer surplus in equilibrium. Finally, use the purple triangle (diamond symbol) to...
Consider the Colombian market for soybeans. The following graph shows the domestic demand and domestic supply...
 Consider the Colombian market for soybeans. The following graph shows the domestic demand and domestic supply curves for soybeans in Colombia. Suppose Colombia's government currently does not allow international trade in soybeans. Use the black point (plus symbol) to indicate the equilibrium price of a ton of soybeans and the equilibrium quantity of soybeans in Colombia in the absence of international trade. Then, use the green triangle (triangle symbol) to shade the area representing consumer surplus in equilibrium. Finally, use the purple...
Consider the Guatemalan market for tangerines. The following graph shows the domestic demand and domestic supply...
 Consider the Guatemalan market for tangerines. The following graph shows the domestic demand and domestic supply curves for tangerines in Guatemala. Suppose Guatemala's government currently does not allow international trade in tangerines Use the black point (plus symbol) to indicate the equilibrium price of a ton of tangerines and the equilibrium quantity of tangerines in Guatemala in the absence of international trade. Then, use the green triangle (triangle symbol) to shade the area representing consumer surplus in equilibrium. Finally, use...
 Consider the Sudanese market for tangerines The following graph shows the domestic demand and domestic supply curves for tangerines in Sudan. Suppose Sudan's government currently does not allow international trade in tangerines Use the black point (plus symbol) to indicate the equilibrium price of a ton of tangerines and the equilibrium quantity of tangerines in Sudan in the absence of international trade. Then, use the green triangle (triangle symbol) to shade the area representing consumer surplus in equilibrium. Finally, use...
 1. Welfare effects of free trade in an exporting country Consider the Sudanese market for tangerines. The following graph shows the domestic demand and domestic supply curves for tangerines in Sudan. Suppose Sudan's government currently does not allow international trade in tangerines. Use the black point (plus symbol) to indicate the equilibrium price of a ton of tangerines and the equilibrium quantity of tangerines in Sudan in the absence of international trade. Then, use the green triangle (triangle symbol) to shade the area...
 The following graph shows the domestic demand and domestic supply curves for tangerines in Panama. Suppose Panama's government currently does not allow international trade in tangerines. Use the black point (plus symbol) to indicate the equilibrium price of a ton of tangerines and the equilibrium quantity of tangerines in Panama in the absence of international trade. Then, use the green triangle (triangle symbol) to shade the area representing consumer surplus in equilibrium. Finally, use the purple triangle (diamond symbol) to...
 Consider the Guatemalan market for tangerines. The following graph shows the domestic demand and domestic supply curves for tangerines in Guatemala. Suppose Guatemala's government currently does not allow international trade in tangerines Use the black point (plus symbol) to indicate the equilibrium price of a ton of tangerines and the equilibrium quantity of tangerines in Guatemala in the absence of international trade. Then, use the green triangle (triangle symbol) to shade the area representing consumer surplus in equilibrium. Finally, use...
Most questions answered within 3 hours.
-
The number of tornadoes in an unspecified year follows a Poisson
distribution with mean 3. Calculate...
asked 1 minute from now -
If a benzene ring has one methyl group as a substituent, will
the next substituent add...
asked 3 minutes ago -
A current of 5.91 A is passed through a Fe(NO3)2 solution for
1.80 h. How much...
asked 16 minutes ago -
A transmission line carries an 800-A current from east to west.
The earth's magnetic field is...
asked 17 minutes ago -
How do Public sectors innovate?
By concentrating on their history and examining the ways these
sectors...
asked 19 minutes ago -
1. Calculate the moles of sodium oxide needed to have 40.1 g of
sodium ions.
asked 33 minutes ago -
A federally related real estate transaction as defined by FIRREA
is
asked 40 minutes ago -
Stronium metal is found to have a face centered cubic crystal
structure. It is measured to...
asked 46 minutes ago -
QUESTION 2
You are the marketing manager for a new brand of soft drink –
“MEGIN...
asked 53 minutes ago -
A battery, a 12 k ohm and a 3 k ohm resistors are connected in
parallel...
asked 57 minutes ago -
1)The all-cis isomer of 1,2,3,4,5,6-hexafluorocyclohexane (for
example, all six fluorines on the same face of the...
asked 59 minutes ago -
The following values for a confined aquifer are measured from
the ground surface: depth to piezometric...
asked 1 hour ago