is hard. SHARE ket Research Reports acdition, the yoiea ANS: say that you have a theory that NCAT students will demonstrate more agreement wit est than SELU students. Your testable hypothesis is as follows : NCAT students will exhibit higher levels of agreement with the Anthem protest than SELU students Independent Samples Test Levene's Test for Equality of Variances t-test for Equality of Means Sig. df Sig. (2-taile 007 3.60 210 Protest Equal variances assumed 7.417 -3.834 169.943 000 Equal variances not assumed Based on the results you see from the table above, should you reject or accept the hypothesis? Answer: I would Accept Reject the hypothesis (2.5pts). 10. On what basis did you make your decision (be specificwhat information from the table above allows you to make the assessment?) (5pts)
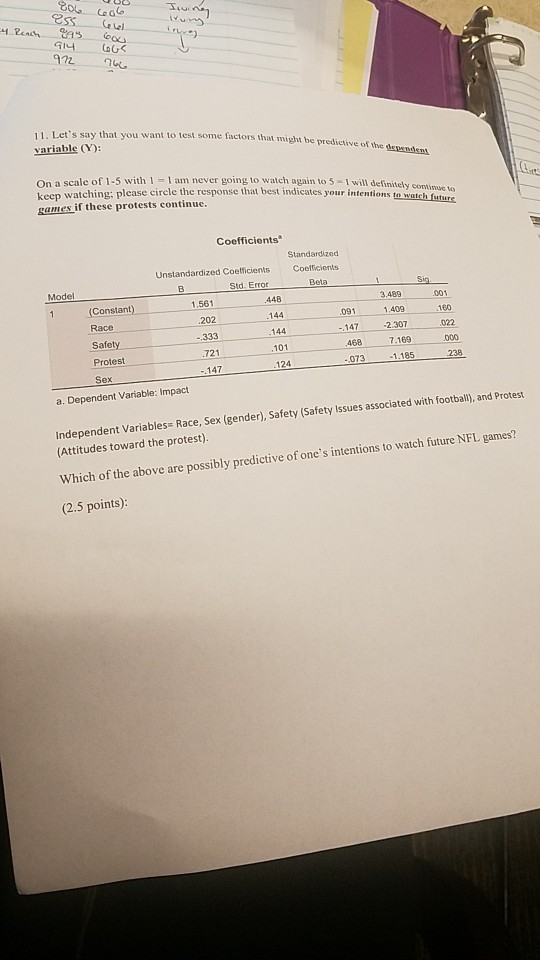
11. Let's say that you want to test some factors that m variable (Y) ight be predictive of the depandent On a scale of 1-5 with 1 I am never going to watch again to 5 I will definitely continus to. keep watching: please circle the response that best indicates your intentions to watch future games if these protests continuc. Coefficients Unstandardized Coefficients Coelicients Beta Model (Constant) 160 144 144 101 124 202 2.307 022 147 Sa 7.169 238 147 a. Dependent Variable: Impact Independent Variables Race, Sex (gender), Safety (Safety Issues associated with football), and Protest (Attitudes toward the protest). Which of the above are possibly predictive of one's intentions to watch future NFL games? (2.5 points)
Homework Answers
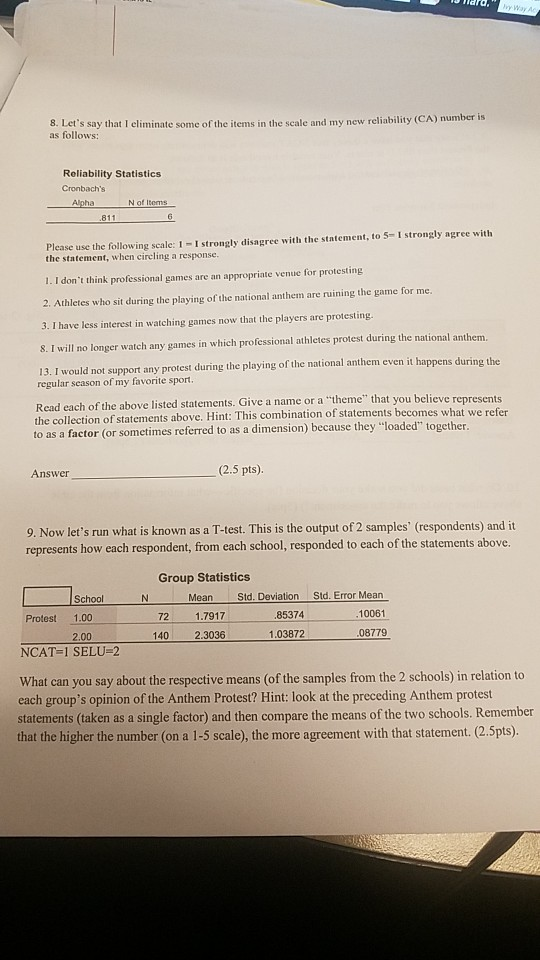
Theme: Protest during National anthem at professional games
9. We can see that the school 2 have a higher mean than School 1 which means that school 2 support the statements more than school 1. School 2 on average support protesting during national anthem less than School 1.
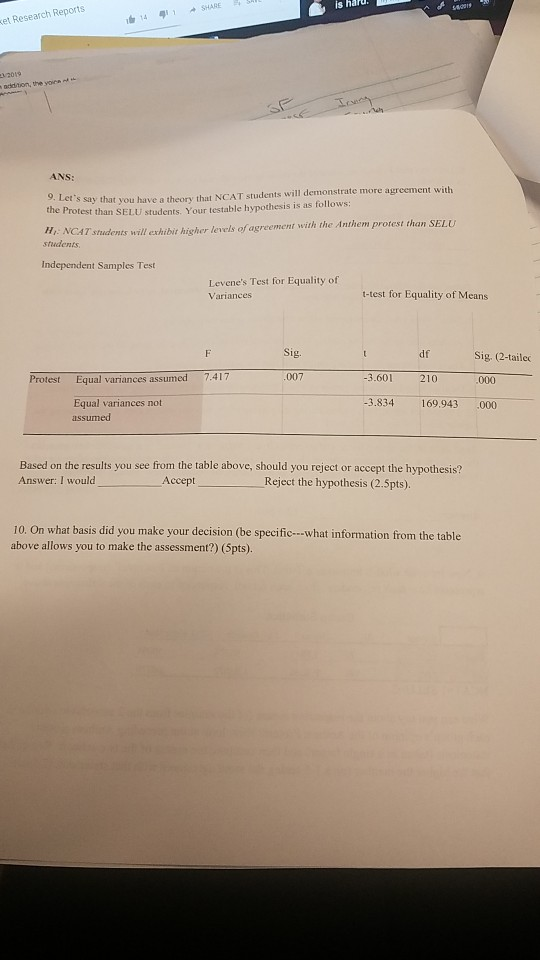
10. The null hypothesis of levene test is rejected that there are
equal variances. It is concluded that there are unequal variances.
Hence, we will use the t-value of -3.834 and the significant
p-value of 0.000.
I would accept the given hypotheses that NCAT students exhibit
higher levels of agreement with the anthem protest than SELU
students as the SELU students have a significantly higher mean
which means that they support less.
11. The variables which are predictive of one's intentions to watch future NFL games are the ones with significant p-values. If the variable has a significant p-value, it means that they have a significant value of coefficient. These variables are "Safety" and "Protest".
Add Answer to:
8. Let's say that I eliminate some of the items in the scale and my ne reliability (CA) number is as follows: Reliability Statistics N of Items 811 I strongly disagree with the stateme...
Most questions answered within 3 hours.
-
Describe how the file manager allocates a file to a single user.
List the steps that...
asked 12 minutes ago -
For the following reaction:
IBr(g) + 4F2(g) → IF5(g) +
BrF3(g)
Compound
ΔH°f (kJ mol-1)...
asked 14 minutes ago -
Assuming the simple probability of even A is given as P(A) and
the simple probability of...
asked 17 minutes ago -
2.- It is known that 20% of the students on campus are smokers.
If 8 students...
asked 17 minutes ago -
Provide a summary/reflection of what you gleaned of how law
enforcement is effect by Unconventional Weapons...
asked 38 minutes ago -
From the following heats of combustion,
CH3OH(l) + 3/2O2(g) → CO2(g) +
2H2O(l)
ΔHorxn = –726.4...
asked 31 minutes ago -
Floating Point Representation
Consider a computer that stores information using 10 bits words.
The first bit...
asked 1 hour ago -
. The theoretical weight percent of carbon in (CH3)3N is:
A. 20.32% B. 81.95% C. 9.97%...
asked 54 minutes ago -
The rate of a certain reaction is given by the following rate
law:
rate = k[H2][I2]...
asked 48 minutes ago -
A 10,000 uF capacitor is in series with a 1 uH inductor. What is
Zeq of...
asked 53 minutes ago -
Draw the molecular orbital diagram for O2-
(oxygen molecule with a negative charge).
asked 1 hour ago -
Of all the different weapons discussed in this chapter that make
up CBRNE,
Which group do...
asked 1 hour ago