
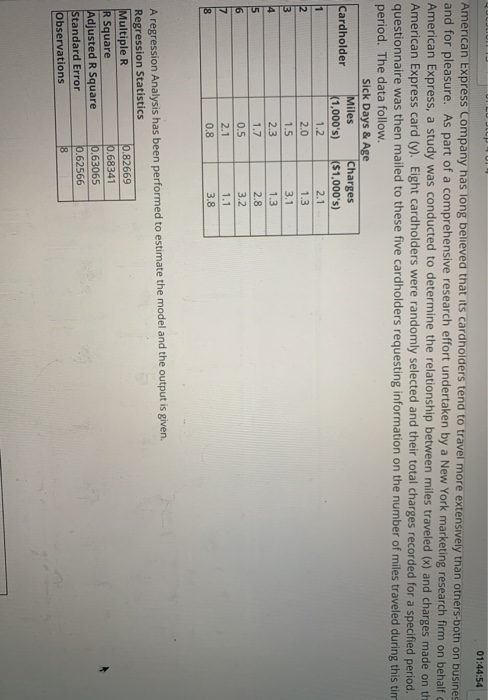
01:44:54 American Express company has long believed that its cardhoiders tend to travel more extensively than others-both on busines and for pleasure. As part of a comprehensive research effort undertaken by a New York marketing research firm on behalf c American Express, a study was conducted to determine the relationship between miles traveled (x) and charges made on th American Express card (y). Eight cardholders were randomly selected and their total charges recorded for a specified period. questionnaire was then mailed to these five cardholders requesting information on the number of miles traveled during this tim period. The data follow. Sick Days & Age iles 1,000's) ($1,000's) harges ardholder 1.2 2.0 1.5 2.1 1.3 3.1 1.3 2.8 3.2 1.1 3.8 1.7 0.5 2.1 0.8 A regression Analysis has been performed to estimate the model and the output is given. Regression Statistics Multiple R R Square Adjusted R Square Standard Error Observations 0.82669 68341 63065 62566
Homework Answers
| X | (x-x̅)² | |
| 1.2 | 0.10 | |
| 2 | 0.24 | |
| 1.5 | 0.00 | |
| 2.3 | 0.62 | |
| 1.7 | 0.04 | |
| 0.5 | 1.03 | |
| 2.1 | 0.35 | |
| 0.8 | 0.51 |
sample size , n = 8
here, x̅ = Σx / n= 1.51
SSxx = Σ(x-x̅)² = 2.8688
step 4)
X Value= 2
Confidence Level= 95%
Sample Size , n= 8
Degrees of Freedom,df=n-2 = 6
critical t Value=tα/2 = 2.447 [excel
function: =t.inv.2t(α/2,df) ]
X̅ = 1.51
Σ(x-x̅)² =Sxx 2.9
Standard Error of the Estimate,Se= 0.63
Predicted Y at X= 2 is
Ŷ = 4.348 + -1.329
* 2 = 1.689
standard error, S(ŷ)=Se*√(1/n+(X-X̅)²/Sxx) =
0.285
margin of error,E=t*Std error=t* S(ŷ) =
2.4469 * 0.2852 =
0.6980
Confidence Lower Limit=Ŷ +E = 1.689
- 0.6980 =
0.99 thousand dollars
Confidence Upper Limit=Ŷ +E = 1.689
+ 0.6980 =
2.39 thousand dollars
Add Answer to:
ANOVA 07003 07003 01138 esidual otal r 9596 81861 01138 (Report answer to 2 decimal places.) m Tables Dollars Dollars Upper 01:44:54 American Express company has long believed that its cardhoide...
and for pleasure. As part of a comprehensive research effort undertaken by a New York marketing research firm on behalf of American Express, a study was conducted to determine the relationship b...
 and for pleasure. As part of a comprehensive research effort undertaken by a New York marketing research firm on behalf of American Express, a study was conducted to determine the relationship between miles traveled (x) and charges made on the American Express card (y). Eight cardholders were randomly selected and their total charges recorded for a specified period. A questionnaire was then mailed to these five cardholders requesting information on the number of miles traveled during this time 2.0 1.5...
theres 4 total questions oare Was teR Mailed to these tive cardhoiders requesting intormation on the numbe time period. The data follow. Sick Days & Age iles 1,000's)K$1,000's) ha...
 theres 4 total questions
oare Was teR Mailed to these tive cardhoiders requesting intormation on the numbe time period. The data follow. Sick Days & Age iles 1,000's)K$1,000's) harges Cardholder 1.2 2.0 1.5 2.3 2.7 1.6 2.5 2.2 4.2 3.2 2.7 0.5 2.1 0.8 reA regression Analysis has been performed to estimate the model and the output is given. Regression Statistics Multiple R R Square Adjusted R Square ,19954 56026 0.31389 71405 tandard Error bservations ANOVA O 2019 01:41:34 A...
theres 4 total questions
oare Was teR Mailed to these tive cardhoiders requesting intormation on the numbe time period. The data follow. Sick Days & Age iles 1,000's)K$1,000's) harges Cardholder 1.2 2.0 1.5 2.3 2.7 1.6 2.5 2.2 4.2 3.2 2.7 0.5 2.1 0.8 reA regression Analysis has been performed to estimate the model and the output is given. Regression Statistics Multiple R R Square Adjusted R Square ,19954 56026 0.31389 71405 tandard Error bservations ANOVA O 2019 01:41:34 A...
 and for pleasure. As part of a comprehensive research effort undertaken by a New York marketing research firm on behalf of American Express, a study was conducted to determine the relationship between miles traveled (x) and charges made on the American Express card (y). Eight cardholders were randomly selected and their total charges recorded for a specified period. A questionnaire was then mailed to these five cardholders requesting information on the number of miles traveled during this time 2.0 1.5...
 theres 4 total questions
oare Was teR Mailed to these tive cardhoiders requesting intormation on the numbe time period. The data follow. Sick Days & Age iles 1,000's)K$1,000's) harges Cardholder 1.2 2.0 1.5 2.3 2.7 1.6 2.5 2.2 4.2 3.2 2.7 0.5 2.1 0.8 reA regression Analysis has been performed to estimate the model and the output is given. Regression Statistics Multiple R R Square Adjusted R Square ,19954 56026 0.31389 71405 tandard Error bservations ANOVA O 2019 01:41:34 A...
theres 4 total questions
oare Was teR Mailed to these tive cardhoiders requesting intormation on the numbe time period. The data follow. Sick Days & Age iles 1,000's)K$1,000's) harges Cardholder 1.2 2.0 1.5 2.3 2.7 1.6 2.5 2.2 4.2 3.2 2.7 0.5 2.1 0.8 reA regression Analysis has been performed to estimate the model and the output is given. Regression Statistics Multiple R R Square Adjusted R Square ,19954 56026 0.31389 71405 tandard Error bservations ANOVA O 2019 01:41:34 A...
Most questions answered within 3 hours.
-
An MNE is this kind of industry when competition in one country
is essentially independent of...
asked 41 minutes ago -
. For this set of questions, determine what
proportion of a normal distribution is located betweeneach...
asked 1 hour ago -
A college student is employed as a door-to-door newspaper
salesman. Historical data suggests that the student...
asked 2 hours ago -
MATLAB HW 11 problem using Switch Case and Input commands
Write a script file that calculates...
asked 1 hour ago -
Considering gravitational time dilation, calculate the time that
passes in Earth’s surface while 1 hour passes...
asked 2 hours ago -
Minitab Problem: Take the Lake Hume June rainfall data and find
use the processes outlined in...
asked 3 hours ago -
X Company is trying to decide whether to continue using old
equipment to make Product A...
asked 3 hours ago -
IN PYTHON ONLY !! Program 2: Re-work
program #5 (WeeklyHours) from the previous assignment such that...
asked 4 hours ago -
The average length of time between arrivals at a turnpike
toll-booth is 26 seconds. What is...
asked 5 hours ago -
(a) A piston at 6.1 atm contains a gas that occupies a volume of
3.5 L....
asked 6 hours ago -
Please answer true or false. Words
cannot be changed or added in to make it true...
asked 6 hours ago -
An empty test tube weighs 15.923 grams. Then,
MgCl2•6H2O is added into the test tube. After...
asked 6 hours ago