Question
*plot the graph show the relation between Xe moisture And
drying rate .. this number take from experment lab .. please
discussion
and write if take wrong number maybe ..


drying rate xe
Homework Answers
Answer #1
HiiIn a drying curve we see that when the amount of the solvent
decrese with the time , the graph reaches a saturation value and
thus we should get a constant value of the drying rate and after
some time zero drying rate .
Saying in reverse the rate should be higher at the higher amount of
the solvent because more solvent is available at the surface.
So the values reported by you is wrong.
Hope it helps .
Thank you
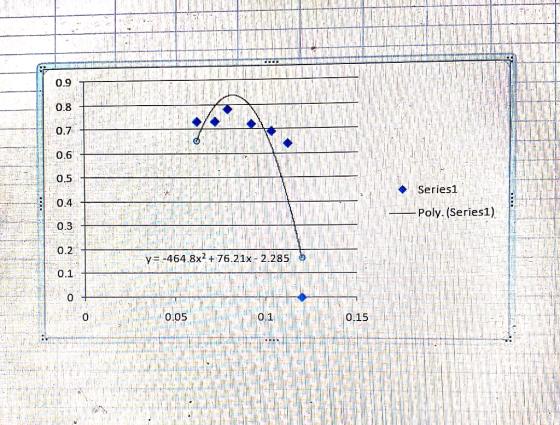
0.9 0.8 0.7 0.6 0.5 0.4 0.3 0.2 0.1 Series1 Poly. (Series1) yー-464-8x2+76 21x-2.285 0.1 0.15
Know the answer?
Add Answer to:
*plot the graph show the relation between Xe moisture And drying rate .. this number take from experment lab .. please discussion and write if take wrong number maybe .. XE Moisture 0.120760.11...
Not the answer you're looking for?
Ask your own homework help question.
Our experts will answer your question WITHIN MINUTES for Free.
Similar Homework Help Questions
ADVERTISEMENT
Need Online Homework Help?
Ask
a QuestionGet Answers For Free
Most questions answered within 3 hours.
Most questions answered within 3 hours.
ADVERTISEMENT
ADVERTISEMENT
Active Questions
-
1. In the short run, the marginal product of labor increases
then decreases because of what?...
asked 47 minutes ago -
A farmer wants to compare the tastiness and juiciness of
tomatoes grown with three amounts of...
asked 1 hour ago -
What is facilitated diffusion and how does it differ from
symport and antiport transportation? How do...
asked 2 hours ago -
if a firm producing 100 units at $5.00 each experience
an 80% experience curve, what will...
asked 2 hours ago -
A solid, uniform disk of radius 0.250 m and mass 53.7 kg rolls
down a ramp...
asked 5 hours ago -
Given the following table of high speed internet access vs.
annual home income:
Home Income
%...
asked 5 hours ago -
A baseball batter hits a 0.145kg baseball straight up into the
air. The baseball leaves the...
asked 6 hours ago -
An FM modulator is tested using
single-tone baseband signal with frequency of 50kHz and a sprectrum...
asked 6 hours ago -
Write the ionic equations for the first stage of salts
hydrolysis.
Anion, Cation?
Na2S
NiSO4
K2SO4...
asked 8 hours ago -
suppose there is a normally distributed population with a mean of
250 and a standard deviation...
asked 8 hours ago -
Question Three
Suppose you as project manager are using the Waterfall
development methodology on a large...
asked 9 hours ago -
Which statement is not true about welfare in Canada?
A.Benefits typically vary based on one's ability...
asked 10 hours ago
ADVERTISEMENT