Random samples of two species of iris gave the following petal lengths (in cm). x1, Iris virginica 5.1 5.9 4.5 4.9 5.7 4.8 5.8 6.4 5.7 5.9 x2, Iris versicolor 4.5 4.3 4.7 5.0 3.8 5.1 4.4 4.2 (a) Use a...
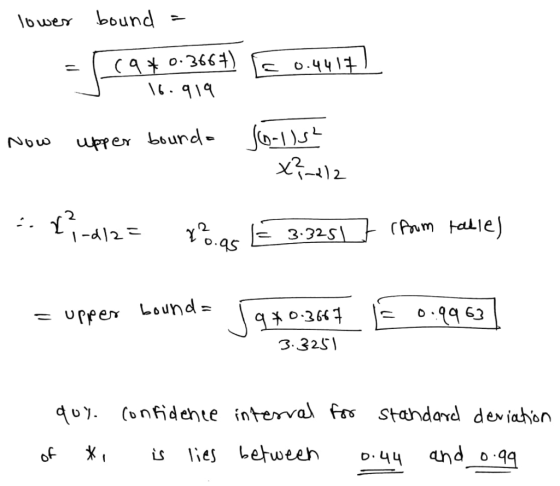
Random samples of two species of iris gave the following petal lengths (in cm). x1, Iris virginica 5.1 5.9 4.5 4.9 5.7 4.8 5.8 6.4 5.7 5.9 x2, Iris versicolor 4.5 4.3 4.7 5.0 3.8 5.1 4.4 4.2 (a) Use a 5% level of significance to test the claim that the population standard deviation of x1 is larger than 0.55. What is the level of significance? State the null and alternate hypotheses. H0: σ = 0.55; H1: σ > 0.55 H0: σ > 0.55; H1: σ = 0.55 H0: σ = 0.55; H1: σ ≠ 0.55 H0: σ = 0.55; H1: σ < 0.55 Find the value of the chi-square statistic for the sample. (Round your answer to two decimal places.) What are the degrees of freedom? What assumptions are you making about the original distribution? We assume a exponential population distribution. We assume a binomial population distribution. We assume a normal population distribution. We assume a uniform population distribution. Find or estimate the P-value of the sample test statistic. P-value > 0.100 0.050 < P-value < 0.100 0.025 < P-value < 0.050 0.010 < P-value < 0.025 0.005 < P-value < 0.010 P-value < 0.005 Will you reject or fail to reject the null hypothesis? Since the P-value > α, we fail to reject the null hypothesis. Since the P-value > α, we reject the null hypothesis. Since the P-value ≤ α, we reject the null hypothesis. Since the P-value ≤ α, we fail to reject the null hypothesis. Interpret your conclusion in the context of the application. At the 5% level of significance, there is insufficient evidence to conclude conclude that the standard deviation is greater than 0.55. At the 5% level of significance, there is sufficient evidence to conclude conclude that the standard deviation is greater than 0.55. (b) Find a 90% confidence interval for the population standard deviation of x1. (Round your answers to two decimal places.) lower limit upper limit (c) Use a 1% level of significance to test the claim that the population variance of x1 is larger than that of x2. Interpret the results. What is the level of significance? State the null and alternate hypotheses. H0: σ12 = σ22; H1: σ12 > σ22 H0: σ12 > σ22; H1: σ12 = σ22 H0: σ22 = σ12; H1: σ22 > σ12 H0: σ12 = σ22; H1: σ12 ≠ σ22 Find the value of the sample F statistic. (Round your answer to two decimal places.) What are the degrees of freedom? dfN = dfD =
Homework Answers


Add Answer to:
Random samples of two species of iris gave the following petal lengths (in cm). x1, Iris virginica 5.1 5.9 4.5 4.9 5.7 4.8 5.8 6.4 5.7 5.9 x2, Iris versicolor 4.5 4.3 4.7 5.0 3.8 5.1 4.4 4.2 (a) Use a...
A random sample of leading companies in South Korea gave the following percentage yields based on...
A random sample of leading companies in South Korea gave the following percentage yields based on assets. 2.1 2.3 4.2 1.9 0.5 3.6 2.4 0.2 1.7 1.8 1.4 5.4 1.1 Use a calculator to verify that s2 ≈ 2.125 for these South Korean companies. Another random sample of leading companies in Sweden gave the following percentage yields based on assets. 2.2 3.8 3.9 1.1 3.9 2.8 2.3 3.5 2.8 Use a calculator to verify that s2 ≈ 0.909 for these...
A new thermostat has been engineered for the frozen food cases in large supermarkets. Both the...
A new thermostat has been engineered for the frozen food cases in large supermarkets. Both the old and new thermostats hold temperatures at an average of 25°F. However, it is hoped that the new thermostat might be more dependable in the sense that it will hold temperatures closer to 25°F. One frozen food case was equipped with the new thermostat, and a random sample of 26 temperature readings gave a sample variance of 5.2. Another similar frozen food case was...
A new thermostat has been engineered for the frozen food cases in large supermarkets. Both the...
A new thermostat has been engineered for the frozen food cases in large supermarkets. Both the old and new thermostats hold temperatures at an average of 25°F. However, it is hoped that the new thermostat might be more dependable in the sense that it will hold temperatures closer to 25°F. One frozen food case was equipped with the new thermostat, and a random sample of 21 temperature readings gave a sample variance of 5.2. Another similar frozen food case was...
Two processes for manufacturing large roller bearings are under study. In both cases, the diameters (in...
Two processes for manufacturing large roller bearings are under study. In both cases, the diameters (in centimeters) are being examined. A random sample of 26 roller bearings from the old manufacturing process showed the sample variance of diameters to be s2 = 0.231. Another random sample of 28 roller bearings from the new manufacturing process showed the sample variance of their diameters to be s2 = 0.146. Use a 5% level of significance to test the claim that there is...
A random sample of 16 values is drawn from a mound-shaped and symmetric distribution. The sample...
A random sample of 16 values is drawn from a mound-shaped and symmetric distribution. The sample mean is 9 and the sample standard deviation is 2. Use a level of significance of 0.05 to conduct a two-tailed test of the claim that the population mean is 8.5. (a) Is it appropriate to use a Student's t distribution? Explain. Yes, because the x distribution is mound-shaped and symmetric and σ is unknown. No, the x distribution is skewed left. No, the...
A random sample of 16 values is drawn from a mound-shaped and symmetric distribution. The sample...
A random sample of 16 values is drawn from a mound-shaped and symmetric distribution. The sample mean is 15 and the sample standard deviation is 2. Use a level of significance of 0.05 to conduct a two-tailed test of the claim that the population mean is 14.5. (a) Is it appropriate to use a Student's t distribution? Explain. Yes, because the x distribution is mound-shaped and symmetric and σ is unknown.No, the x distribution is skewed left. No, the x distribution...
The age distribution of the Canadian population and the age distribution of a random sample of...
The age distribution of the Canadian population and the age distribution of a random sample of 455 residents in the Indian community of a village are shown below. Age (years) Percent of Canadian Population Observed Number in the Village Under 5 7.2% 52 5 to 14 13.6% 75 15 to 64 67.1% 282 65 and older 12.1% 46 Use a 5% level of significance to test the claim that the age distribution of the general Canadian population fits the age...
Let x be a random variable that represents red blood cell count (RBC) in millions of...
 Let x be a random variable that represents red blood
cell count (RBC) in millions of cells per cubic millimeter of whole
blood. Then x has a distribution that is approximately
normal. For the population of healthy female adults, suppose the
mean of the x distribution is about 4.78. Suppose that a
female patient has taken six laboratory blood tests over the past
several months and that the RBC count data sent to the patient's
doctor are as follows.
4.9...
Let x be a random variable that represents red blood
cell count (RBC) in millions of cells per cubic millimeter of whole
blood. Then x has a distribution that is approximately
normal. For the population of healthy female adults, suppose the
mean of the x distribution is about 4.78. Suppose that a
female patient has taken six laboratory blood tests over the past
several months and that the RBC count data sent to the patient's
doctor are as follows.
4.9...
Let x be a random variable that represents red blood cell count (RBC) in millions of...
Let x be a random variable that represents red blood cell count (RBC) in millions of cells per cubic millimeter of whole blood. Then x has a distribution that is approximately normal. For the population of healthy female adults, suppose the mean of the x distribution is about 4.66. Suppose that a female patient has taken six laboratory blood tests over the past several months and that the RBC count data sent to the patient's doctor are as follows. 4.9...
Let x be a random variable that represents hemoglobin count (HC) in grams per 100 milliliters...
Let x be a random variable that represents hemoglobin count (HC) in grams per 100 milliliters of whole blood. Then x has a distribution that is approximately normal, with population mean of about 14 for healthy adult women. Suppose that a female patient has taken 10 laboratory blood tests during the past year. The HC data sent to the patient's doctor are as follows. 16 19 16 18 15 11 14 16 16 12 (i) Use a calculator with sample...
 Let x be a random variable that represents red blood
cell count (RBC) in millions of cells per cubic millimeter of whole
blood. Then x has a distribution that is approximately
normal. For the population of healthy female adults, suppose the
mean of the x distribution is about 4.78. Suppose that a
female patient has taken six laboratory blood tests over the past
several months and that the RBC count data sent to the patient's
doctor are as follows.
4.9...
Let x be a random variable that represents red blood
cell count (RBC) in millions of cells per cubic millimeter of whole
blood. Then x has a distribution that is approximately
normal. For the population of healthy female adults, suppose the
mean of the x distribution is about 4.78. Suppose that a
female patient has taken six laboratory blood tests over the past
several months and that the RBC count data sent to the patient's
doctor are as follows.
4.9...
Most questions answered within 3 hours.
-
ORGANIC CHEMISTRY QUESTION 5
PART A--------
Describe a chemical test for the identification of a double...
asked 53 minutes ago -
Both Terence and Tong work at a local actuarial consulting firm
in Des Moines.
Terence arrives...
asked 1 hour ago -
QUESTION 11
. THE RESTING POTENTIAL IS CAUSED BY
.
. A.
. the rotation of...
asked 1 hour ago -
Need them in c++
1. Give the code for the
definition of a node for
the linked implementation of
a tree that contains...
asked 1 hour ago -
For sputtering-cleaning and sputter-depositing a metal,
would you use an AC or DC plasma? Explain your...
asked 1 hour ago -
Defend ONE of the following statements:
Prices should reflect the value consumers are willing to
pay....
asked 1 hour ago -
A magnet of mass 0.10 kg is dropped from rest and falls
vertically through a 20.0...
asked 1 hour ago -
A friend approaches you about a nutritional product and ask you
if it is worth it....
asked 1 hour ago -
What is bacterial transformation? What are the differences and
similarities between transforming a bacterial cell with...
asked 1 hour ago -
A wire loop 20 cm high is dipped in soap solution and then held
vertically to...
asked 1 hour ago -
OK, now you're all mixed up and you slam into the wall with your
car (total...
asked 1 hour ago -
1. A.Explain why the spread (variance) of a sampling
distribution for estimating a mean would be...
asked 1 hour ago