


Regression [DataSetll C:\Usersn.little5773 Downloads\child data.sav Variables Entered/Removed Variables Entered Variables Removed Method Model Enter age a. Dependent Variable: reading ability b. All requested variables entered. Model Summary Adjusted R Square Std. Error o R Square 716 a. Predictors: (Constant, age the Estimate Model 846a 700 37661 ANOVAa Sum of Squares Mean Square df Sig Model 6.427 2.553 8.980 000b Regression Residual Total 6.427 45.313 142 18 19 a. DependentVariable: reading ability b. Predictors: (Constant), age Coefficients Standardized Unstandardized Coefficients Coefficients Std. Error Beta Sig Model 493 6.155 (Constant) 3.032 081 542 846 6.731 age a. DependentVariable: reading ability
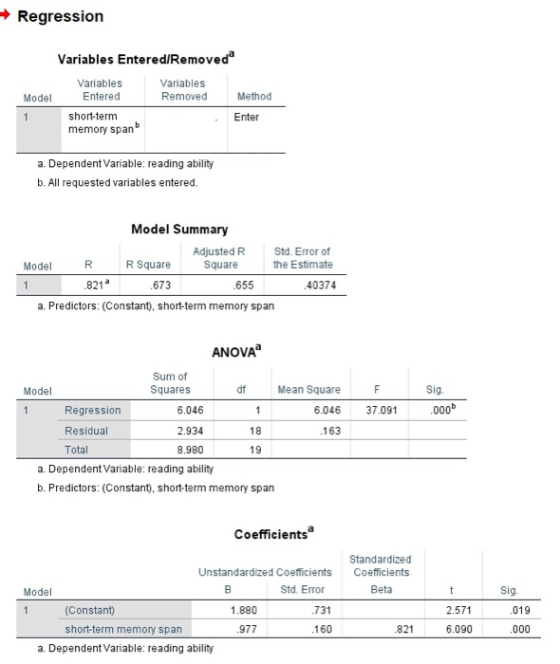
Regression Variables Entered/Removed Variables Removed Variables Entered Method Model short-term Enter memory span a. Dependent Variable: reading ability b. All requested variables entered. Model Summary Adjusted R Square Std . Error of he Estimate R Square Model 673 821 655 40374 a. Predictors: (Constant), short-term memory span ANOVA Sum of Squares df Mean Square 6.046 163 Sig Model 000b Regression Residual Total 6.046 2.934 8.980 37.091 19 a. Dependent Variable: reading ability b. Predictors: (Constant), short-term memory span Coefficients Standardized Unstandardized Coefficients Coefficients Beta Std. Error Sig Model 731 160 (Constant) short-term memory span 1.880 2.571 019 6.090 821 a. Dependent Variable: reading ability
Regression Variables Entered/Removed Variables Entered Variables Removed Method Model Enter IQ a. Dependent Variable: reading ability b. All requested variables entered. Model Summary Adjusted R Square Std. Error of the Estimate R Square 023 a. Predictors: (Constant), IQ Model 69829 150 .032 ANOVAa Sum of Squares df Mean Square 203 488 Sig Model -203 527b Regression Residual Total 417 18 8.980 19 a. Dependent Variable: reading ability b. Predictors: (Constant), IQ Coefficients Standardized Coefficients Beta Unstandardized Coefficients Std. Error Sig Model 4.719 2.454 025 070 527 Constant) IQ 1.923 016 150 645 a. Dependent Variable: reading ability
Regression Variables Entered/Removed Variables Removed Variables Entered shor-term memory span, age Method Model Enter a. Dependent Variable: reading ability b. All requested variables entered. Model Summary Adjusted FR Square Std. Error of the Estimate 31920 R Square Model 784 807 898a a. Predictors: (Constant), short-term memory span, age ANOVA Sum of Squares df Mean Square Sig Model 000b Regression Residual Total 7.248 1.732 8.980 3.624 35.568 17 102 a. Dependent Variable: reading ability b. Predictors: (Constant), short-term memory span, age Coefficients" Standardized Coefficients Beta Unstandardized Coefficients 8 Std. Error Sig Model 1.897 339 521 3.281 3.435 2.839 (Constant age short-term memory span 578 099 184 004 003 011 530 438 a. Dependent Variable: reading ability
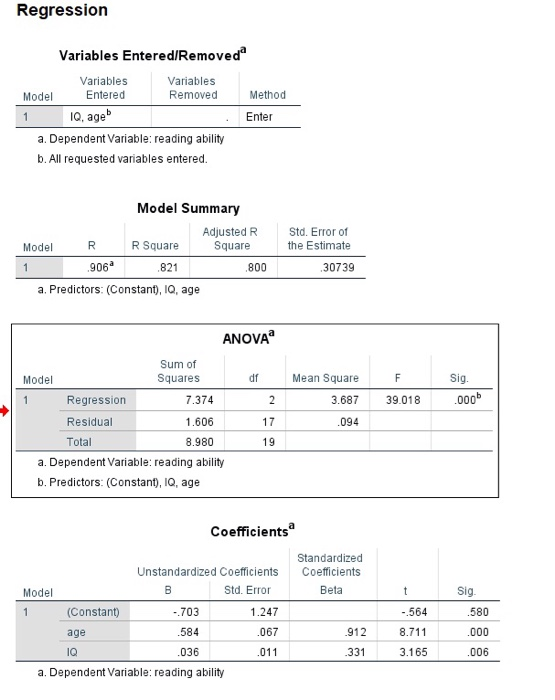
Regression Variables Entered/Removed Variables Entered Variables Removed Model Method IQ, ageb Enter a. Dependent Variable: reading ability b. All requested variables entered Model Summary Adjusted R Square Std. Error of the Estimate R Square Model 821 800 906a 30739 a. Predictors: (Constant), IQ, age ANOVAa Sum of Squares Sig df Mean Square Model 3.687 39.018 000b 7.374 1.606 8.980 Regression Residual Total 17 094 19 a. Dependent Variable: reading ability b. Predictors: (Constant), IQ, age Coefficients Standardized Unstandardized Coefficients Coefficients Std. Error Beta Sig Model 580 (Constant) age IO .703 584 036 1.247 067 011 .564 912 3.165 006 331 a. Dependent Variable: reading ability
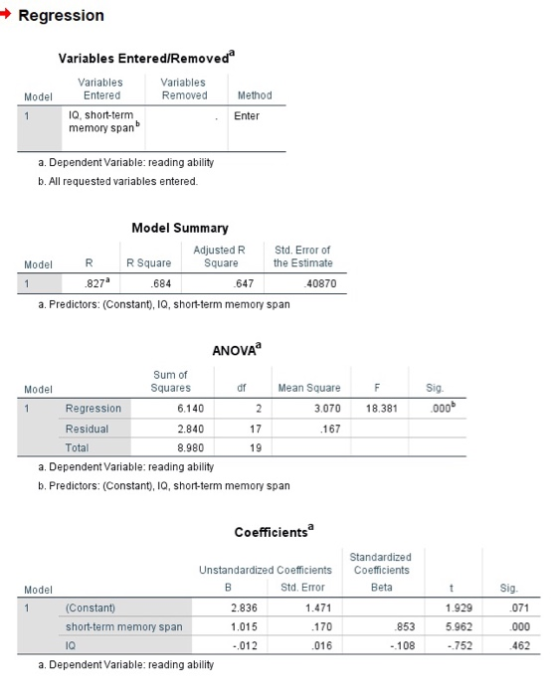
Regression Variables Entered/Removed Variables Entered IQ, short-term memory span Variables Removed Method Model Enter a. Dependent Variable: reading ability b. All requested variables entered. Model Summary Adjusted R Square Std. Error of the Estimate R Square Model 827 684 647 40870 a. Predictors: (Constant), IQ, short-term memory span ANOVA Sum of Squares df Mean Square Sig. Model 3.070 18.381 ,000b Regression Residual Total 6.140 2.840 8.980 167 19 a. Depenent Variable: reading ability b. Predictors: (Constant), IQ, short-term memory span Coefficients Unstandardized Coefficients Coefficients Std. Error Beta Sig Model 1.929 5.962 752 071 Constant) short-term memory span IQ 2.836 1.015 012 1.471 170 016 853 462 108 a. Dependent Vaiable: reading ability
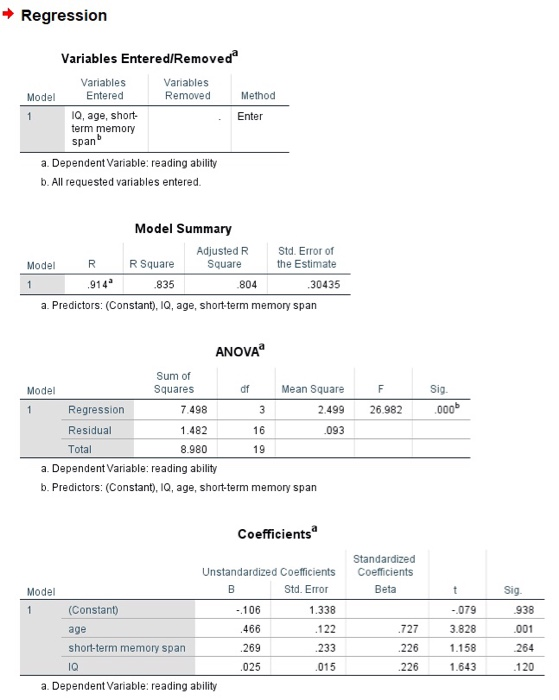
Regression Variables Entered/Removed Variables Entered Q, age, short- term memory Variables Removed Method Model Enter a. Dependent Variable: reading ability b. All requested variables entered. Model Summary Adjusted R Square Std. Error of the Estimate R Square Model 804 914 30435 835 a. Predictors: (Constant), IQ, age, short-term memory span ANOVA Sum of Squares Sig. df Mean Square Model 2499 26 982 .000 Regression Residual Total 7.498 1.482 8.980 093 19 a. Dependent Variable: reading ability b. Predictors: (Constant), Q, age, short-term memory span Coefficients Standardized Unstandardized Coefficients Coefficients Std. Error Beta Sig. Model 106 466 269 025 1.338 122 -233 015 (Constant) age short-term memory span IQ 079 3.828 1.158 1.643 938 001 264 120 727 226 226 a. Dependent Variable: reading ability
Homework Answers
we use the model with age, short-term memory span and IQ as independent variables
y^ = -0.106 + 0.466 age + 0.269 memory span + 0.025 IQ
se = 0.30435
df = 16
point estimate =
y^ = -0.106 + 0.466 age + 0.269 memory span + 0.025 IQ
= -0.106 + 0.466 *6 + 0.269 *4.2 + 0.025*91
= 6.0948
t = t.inv.2t(0.05,16) = 2.1199
95% approx confidence interval
= y^ +- t * 0.4*se
=6.0948 +- 2.12 * 0.4*0.30435
= ( 5.8367 , 6.35288 )
95% approximate prediction interval
= y^ +- t * 1.1*se
= 6.0948 +- 2.12 * 1.1*0.30435
= ( 5.38505 , 6.80454)
Add Answer to:
Models 1-7 are below Part C: Select one model you would use to explain reading ability.,Then use that model to find the 95% confidence interval estimate for the mean reading ability 95% p...
A researcher uses two regression models to seek answers to two research questions. These models a...
 A researcher uses two
regression models to seek answers to two research questions. These
models are:
Y1 = Bo1 + B11X1
Y2 = Bo2 + B12X1 + B22X12
Test the null hypotheses for both models. Use the results of
your analyses to recommend an appropriate model. In each of the
above two cases, state your null and alternative hypotheses,
decision criteria, decision and conclusion.
The level of significance is 5%. The data for this study are
presented in the table...
A researcher uses two
regression models to seek answers to two research questions. These
models are:
Y1 = Bo1 + B11X1
Y2 = Bo2 + B12X1 + B22X12
Test the null hypotheses for both models. Use the results of
your analyses to recommend an appropriate model. In each of the
above two cases, state your null and alternative hypotheses,
decision criteria, decision and conclusion.
The level of significance is 5%. The data for this study are
presented in the table...
From the three three Regression tests, come up with three hypotheses. Regression Method Variables Entered/Removeda Variables...
 From the three three Regression tests, come up with three
hypotheses.
Regression Method Variables Entered/Removeda Variables Model Variables Entered Removed 1 TotElectb a. Dependent Variable: Variety Seeking b. All requested variables entered. Enter Model Summary Adjusted R R Square Square .009 .002 Model R Std. Error of the Estimate .64205 1 .0958 a. Predictors: (Constant), TotElect Coefficients a Standardized Coefficients Model Unstandardized Coefficients B Std. Error 3.667 . 108 Beta t Sig. .000 1 (Constant) 34.075 TotElect .008 .007 .095...
From the three three Regression tests, come up with three
hypotheses.
Regression Method Variables Entered/Removeda Variables Model Variables Entered Removed 1 TotElectb a. Dependent Variable: Variety Seeking b. All requested variables entered. Enter Model Summary Adjusted R R Square Square .009 .002 Model R Std. Error of the Estimate .64205 1 .0958 a. Predictors: (Constant), TotElect Coefficients a Standardized Coefficients Model Unstandardized Coefficients B Std. Error 3.667 . 108 Beta t Sig. .000 1 (Constant) 34.075 TotElect .008 .007 .095...
Model Summary Adjusted R Square Std. Error of the Estimate Model R R Square 1 .843a...
 Model Summary Adjusted R Square Std. Error of the Estimate Model R R Square 1 .843a .711 .707 7.812812 a. Predictors: (Constant), Fuel efficiency, Horsepower Coefficientsa Standardized Coefficients Beta Sig 2.354 .020 Unstandardized Coefficients Model B Std. Error 1 (Constant) 28.144 11.954 Horsepower 229 .013 Length - 219 Fuel efficiency -.090 .185 a. Dependent Variable: Price in thousands .906 16.989 ,000 .050 - 205 -4.348 .000 -.027 -.488 .627 Model Summary Adjusted R Square Std. Error of the Estimate Model...
Regression Variables Entered/Removeda Model Variables Entered Variables Removed Method 1 Warranty_Yearsb . Enter a. Dependent Variable:...
Regression Variables Entered/Removeda Model Variables Entered Variables Removed Method 1 Warranty_Yearsb . Enter a. Dependent Variable: Number_of_people_mentioned b. All requested variables entered. Model Summary Model R R Square Adjusted R Square Std. Error of the Estimate 1 .503a .253 .251 .95930 a. Predictors: (Constant), Warranty_Years ANOVAa Model Sum of Squares df Mean Square F Sig. 1 Regression 80.590 1 80.590 87.574 .000b Residual 237.425 258 .920 Total 318.015 259 a. Dependent Variable: Number_of_people_mentioned b. Predictors: (Constant), Warranty_Years Coefficientsa Model Unstandardized...
please help with step by step calculations Variables Entered/Removed Variables Removed Model Variables Entered) Method contraception...
 please help with step by step calculations
Variables Entered/Removed Variables Removed Model Variables Entered) Method contraception use (%) Enter a. All requested variables entered. b. Dependent Variable: fertility rate per woman Model Summary Std. Error of the Estimate Model R .71764 Adjusted R2 Square .469 220 168 a. Predictors: (Constant), contraception use %) ANOVA Model Sum of Squares Idf Regression 2.177 Residual 7.725 Total 9.902 Mean Square 2.177 .515 a. Predictors: (Constant), contraception use (%) b. Dependent Variable: fertility rate...
please help with step by step calculations
Variables Entered/Removed Variables Removed Model Variables Entered) Method contraception use (%) Enter a. All requested variables entered. b. Dependent Variable: fertility rate per woman Model Summary Std. Error of the Estimate Model R .71764 Adjusted R2 Square .469 220 168 a. Predictors: (Constant), contraception use %) ANOVA Model Sum of Squares Idf Regression 2.177 Residual 7.725 Total 9.902 Mean Square 2.177 .515 a. Predictors: (Constant), contraception use (%) b. Dependent Variable: fertility rate...
QUESTION 6 Model Summary Model R R Square Adjusted R Square Std. Error of the Estimate...
QUESTION 6 Model Summary Model R R Square Adjusted R Square Std. Error of the Estimate 1 .641a .410 .406 4.507 a. Predictors: (Constant), age 3 groups, Total Mastery, Total Optimism Coefficientsa Model Unstandardized Coefficients Standardized Coefficients t Sig. B Std. Error Beta 1 (Constant) 50.016 1.409 35.508 .000 Total Mastery -.786 .067 -.526 -11.719 .000 Total Optimism -.217 .060 -.164 -3.623 .000 age 3 groups -.712 .275 -.098 -2.588 .010 a. Dependent Variable: Total perceived stress What proportion of...
Overview of the Study: The data are based on a Comprehensive School Reform (CSR) Initiative that...
Overview of the Study: The data are based on a Comprehensive School Reform (CSR) Initiative that focused on the improvement of reading and writing for students in the primary grade. The school received a grant from the state which was used to strengthen classroom teachers’ instructional skills. The regression outputs present information for students in the school. Description of the variables: Please use the following description/coding to help you in your analyses. Gender: female; 1 male=0 Coding – Gender female...
Linear regression analysis of the data revealed the following: Model Summary Model R R Square Adjusted...
Linear regression analysis of the data revealed the following: Model Summary Model R R Square Adjusted R Square Std. Error of the Estimate 1 .695a .483 .478 13.02473 a. Predictors: (Constant), exercise, gender, subject's age, depressed state of mind ANOVAa Model Sum of Squares df Mean Square F Sig. 1 Regression 65230.870 4 16307.718 96.129 .000b Residual 69893.149 412 169.644 Total 135124.019 416 a. Dependent Variable: Life Purpose and Satisfaction b. Predictors: (Constant), exercise, gender, subject's age, depressed state of...
Dummy Variable Regression: Choose any metric variable as the dependent variable (you can use the ...
 Dummy Variable Regression: Choose any metric variable as the
dependent variable (you can use the same one that you used in Part
A) and choose gender as an independent variable. Also choose one
more metric variable as an additional independent variable. Once
again, however, you must sort through the metric independent
variables until you find one that, along with gender, produces a
significant F-calc. Use alpha = .05 here as well. You
only need to report the model that produced...
Dummy Variable Regression: Choose any metric variable as the
dependent variable (you can use the same one that you used in Part
A) and choose gender as an independent variable. Also choose one
more metric variable as an additional independent variable. Once
again, however, you must sort through the metric independent
variables until you find one that, along with gender, produces a
significant F-calc. Use alpha = .05 here as well. You
only need to report the model that produced...
43 college students 44% male, 56% female Students reported on the number of hours spent studying...
43 college students 44% male, 56% female Students reported on the number of hours spent studying per week (0-40 hours), their life satisfaction (scale from 0-100), degree of stress they experienced over the last month (scale 0-5), and completed an IQ test (40-160). Students also reported their gender (1=male, 2=female) and cumulative GPA. For the statistical analysis performed, you need to provide responses to two questions: What type of statistical analysis was used to examine what kind of research question?...
 A researcher uses two
regression models to seek answers to two research questions. These
models are:
Y1 = Bo1 + B11X1
Y2 = Bo2 + B12X1 + B22X12
Test the null hypotheses for both models. Use the results of
your analyses to recommend an appropriate model. In each of the
above two cases, state your null and alternative hypotheses,
decision criteria, decision and conclusion.
The level of significance is 5%. The data for this study are
presented in the table...
A researcher uses two
regression models to seek answers to two research questions. These
models are:
Y1 = Bo1 + B11X1
Y2 = Bo2 + B12X1 + B22X12
Test the null hypotheses for both models. Use the results of
your analyses to recommend an appropriate model. In each of the
above two cases, state your null and alternative hypotheses,
decision criteria, decision and conclusion.
The level of significance is 5%. The data for this study are
presented in the table...
 From the three three Regression tests, come up with three
hypotheses.
Regression Method Variables Entered/Removeda Variables Model Variables Entered Removed 1 TotElectb a. Dependent Variable: Variety Seeking b. All requested variables entered. Enter Model Summary Adjusted R R Square Square .009 .002 Model R Std. Error of the Estimate .64205 1 .0958 a. Predictors: (Constant), TotElect Coefficients a Standardized Coefficients Model Unstandardized Coefficients B Std. Error 3.667 . 108 Beta t Sig. .000 1 (Constant) 34.075 TotElect .008 .007 .095...
From the three three Regression tests, come up with three
hypotheses.
Regression Method Variables Entered/Removeda Variables Model Variables Entered Removed 1 TotElectb a. Dependent Variable: Variety Seeking b. All requested variables entered. Enter Model Summary Adjusted R R Square Square .009 .002 Model R Std. Error of the Estimate .64205 1 .0958 a. Predictors: (Constant), TotElect Coefficients a Standardized Coefficients Model Unstandardized Coefficients B Std. Error 3.667 . 108 Beta t Sig. .000 1 (Constant) 34.075 TotElect .008 .007 .095...
 Model Summary Adjusted R Square Std. Error of the Estimate Model R R Square 1 .843a .711 .707 7.812812 a. Predictors: (Constant), Fuel efficiency, Horsepower Coefficientsa Standardized Coefficients Beta Sig 2.354 .020 Unstandardized Coefficients Model B Std. Error 1 (Constant) 28.144 11.954 Horsepower 229 .013 Length - 219 Fuel efficiency -.090 .185 a. Dependent Variable: Price in thousands .906 16.989 ,000 .050 - 205 -4.348 .000 -.027 -.488 .627 Model Summary Adjusted R Square Std. Error of the Estimate Model...
 please help with step by step calculations
Variables Entered/Removed Variables Removed Model Variables Entered) Method contraception use (%) Enter a. All requested variables entered. b. Dependent Variable: fertility rate per woman Model Summary Std. Error of the Estimate Model R .71764 Adjusted R2 Square .469 220 168 a. Predictors: (Constant), contraception use %) ANOVA Model Sum of Squares Idf Regression 2.177 Residual 7.725 Total 9.902 Mean Square 2.177 .515 a. Predictors: (Constant), contraception use (%) b. Dependent Variable: fertility rate...
please help with step by step calculations
Variables Entered/Removed Variables Removed Model Variables Entered) Method contraception use (%) Enter a. All requested variables entered. b. Dependent Variable: fertility rate per woman Model Summary Std. Error of the Estimate Model R .71764 Adjusted R2 Square .469 220 168 a. Predictors: (Constant), contraception use %) ANOVA Model Sum of Squares Idf Regression 2.177 Residual 7.725 Total 9.902 Mean Square 2.177 .515 a. Predictors: (Constant), contraception use (%) b. Dependent Variable: fertility rate...
 Dummy Variable Regression: Choose any metric variable as the
dependent variable (you can use the same one that you used in Part
A) and choose gender as an independent variable. Also choose one
more metric variable as an additional independent variable. Once
again, however, you must sort through the metric independent
variables until you find one that, along with gender, produces a
significant F-calc. Use alpha = .05 here as well. You
only need to report the model that produced...
Dummy Variable Regression: Choose any metric variable as the
dependent variable (you can use the same one that you used in Part
A) and choose gender as an independent variable. Also choose one
more metric variable as an additional independent variable. Once
again, however, you must sort through the metric independent
variables until you find one that, along with gender, produces a
significant F-calc. Use alpha = .05 here as well. You
only need to report the model that produced...
Most questions answered within 3 hours.
-
Little’s Law: Val d’Costa is a world famous ski village in the
French Alps. Because of...
asked 2 minutes ago -
Find the absolute error D for the calculation if A + B/C=D A=
9.4 +/- 0.4...
asked 16 minutes ago -
New Air Heating and Cooling, manufactures furnaces and central
air units. The company pride itself on...
asked 29 minutes ago -
A coach uses a new technique to train gymnasts. Seven
gymnasts were randomly selected and their...
asked 2 hours ago -
While rotating the tires on your car you notice a rock [mass =
0.1 Kg] stuck...
asked 4 hours ago -
Using MARS simulator, write MIPS programs according to
the following scenarios: Receive a positive integer number...
asked 6 hours ago -
An object in front of a concave mirror has a real image that is
11.5 cm...
asked 6 hours ago -
Consider the reaction, C3 H8 + O2 --> CO2 + H2O. How many
moles of O2...
asked 8 hours ago -
You and your opponent both roll a fair die. If you both roll the
same number,...
asked 8 hours ago -
In a study of the accuracy of fast food drive-through orders,
Restaurant A had 257 accurate...
asked 8 hours ago -
Identify and describe in detail the four categories of
institutions that could be included in a...
asked 8 hours ago -
In python
class Customer:
def __init__(self, customer_id, last_name, first_name, phone_number, address):
self._customer_id = int(customer_id)
self._last_name =...
asked 8 hours ago