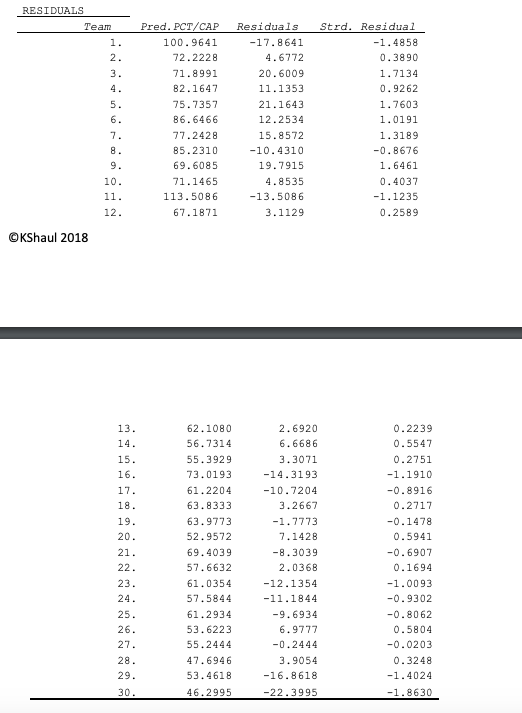
RESIDUALS Pred. PCT/CAP Residuals Strd. Residual -1.4858 0.3890 1.7134 0.9262 1.7603 1.0191 1.3189 0.8676 1.6461 0.4037 -1.1235 0.2589 100.9641 72.2228 71.8991 82.1647 75.7357 86.6466 77.2428 85.2310 69.6085 71.1465 113.5086 67.1871 -17.8641 .6772 20.6009 11.1353 21.1643 12.2534 15.8572 -10.4310 19.7915 4.8535 -13.5086 3.1129 10 12 ©KShaul 2018 2.6920 6.6686 3.3071 -14.3193 -10.7204 3.2667 1.7773 7.1428 -8.3039 2.0368 -12.1354 -11.1844 -9.6934 6.9777 -0.2444 3.9054 -16.8618 0.2239 0.5547 0.2751 -1.1910 -0.8916 0.2717 -0.1478 0.5941 -0.6907 0.1694 -1.0093 -0.9302 -0.8062 0.5804 -0.0203 0.3248 -1.4024 62.1080 56.7314 55.3929 73.0193 61.2204 63.83313 63.9773 52.9572 69.4039 57.6632 61.0354 57.5844 61.2934 53.6223 55.2444 47.6946 53.4618 46.2995 15 21 27 30
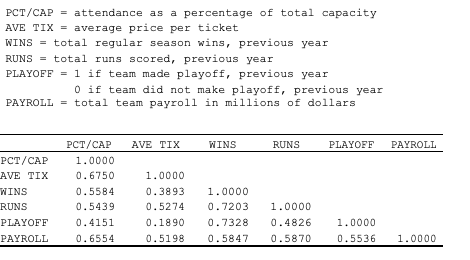
PCT/CAP attendance as a percentage of total capacity AVE TIX = ave rage price per ticket WINStotal regular season wins, previous year RUNStotal runs scored, previous year PLAYOFF = 1 if team made playoff, previous year 0 if team did not make playoff, previous year PAYROLL = total team payroll in millions of dollars PCT/CAP AVE TIX WINS RUNS PLAYOFF PAYROLL PCT/CAP AVE T WINS RUNS PLAYOFF PAYROLL 1.0000 0.6750 0.5584 0.5439 0.4151 0.6554 1.0000 0.3893 1.0000 0.5274 7203 1.0000 0.1890 .7328 0.4826 1.0000 0.5198 0.5847 0.5870 IX 0.5536 1.0000
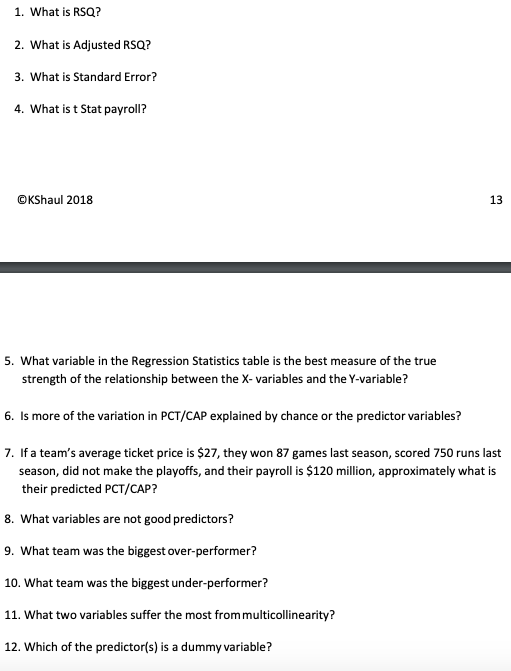
1. What is RSQ? 2. What is Adjusted RSQ? 3. What is Standard Error? 4. What is t Stat payroll? OKShaul 2018 13 5. What variable in the Regression Statistics table is the best measure of the true strength of the relationship between the X- variables and the Y-variable? 6. Is more of the variation in PCT/CAP explained by chance or the predictor variables? 7. If a team's average ticket price is $27, they won 87 games last season, scored 750 runs last season, did not make the playoffs, and their payroll is $120 million, approximately what is their predicted PCT/CAP? 8. What variables are not good predictors? 9. What team was the biggest over-performer? 10. What team was the biggest under-performer? 11. What two variables suffer the most from multicollinearity? 12. Which of the predictor(s) is a dummy variable?
Homework Answers
1)
R^2 = SS regression/SS Total
= 6614.334/10806.4497 = 0.61207
2)
n = 30 , k = 5
adjusted R^2 = 1 - (1- R^2)(n-1)/(n-k-1)
= 1- (1- 0.61207) ( 29 / 24 )
= 0.53125
3)
standard error = sqrt(MSE) = sqrt(174.6715)
= 13.21633
4)
t Stat payroll = coeff/Standard error
= 0.1928/0.0726
= 2.6556
5)
AVE TIX is best predictor
as its TS has highest magnitude
this is because it has highest correlation with dependent
variable
Please rate
Please post rest questions again
Add Answer to:
Study Prep, Chapter 13: Correlation, Simple Linear Regression, Multiple Regression MULTIPLE REGRESSION Major League Baseball Team (Team) recently hired Trixie, a third year student in the Fowler C...
Study Prep, Chapter 13: Correlation, Simple Linear Regression, Multiple Regression MULTIPLE REGRESSION Major League Baseball Team (Team) recently hired Trixie, a third year student in the Fowler Co...
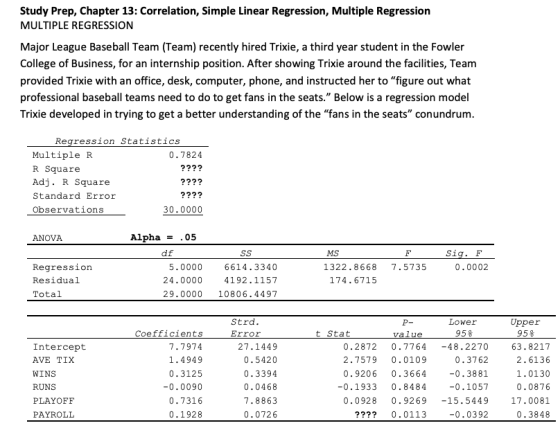
 Study Prep, Chapter 13: Correlation, Simple Linear Regression, Multiple Regression MULTIPLE REGRESSION Major League Baseball Team (Team) recently hired Trixie, a third year student in the Fowler College of Business, for an internship position. After showing Trixie around the facilities, Team provided Trixie with an office, desk, computer, phone, and instructed her to "figure out what professional baseball teams need to do to get fans in the seats." Below is a regression model Trixie developed in trying to get a...
 Study Prep, Chapter 13: Correlation, Simple Linear Regression, Multiple Regression MULTIPLE REGRESSION Major League Baseball Team (Team) recently hired Trixie, a third year student in the Fowler College of Business, for an internship position. After showing Trixie around the facilities, Team provided Trixie with an office, desk, computer, phone, and instructed her to "figure out what professional baseball teams need to do to get fans in the seats." Below is a regression model Trixie developed in trying to get a...
Most questions answered within 3 hours.
-
How much 0.1200 M sodium hydroxide solution is need to titrate
14 mL of a 0.100...
asked 1 minute ago -
1a)When a 5000-kg roller coaster train full of riders approaches
the loading dock at a speed...
asked 25 minutes ago -
The Poseidon Swim Company produces swim trunks. The average
selling price for one of their swim...
asked 21 minutes ago -
If the elasticity of supply of a good is ∞, then its
A. supply curve is...
asked 7 minutes ago -
An impulse is a change in momentum usually over
a short time. For which of the...
asked 5 minutes ago -
Write an application for the Shady Rest Hotel; the program
determines the price of a room....
asked 11 minutes ago -
USE THE FOLLOWING INFORMATION TO ANSWER THE NEXT (6)
QUESTIONS:
The following is a December 31,...
asked 28 minutes ago -
Suppose you plan to invest $5,000 each year (beginning at the
end of this year) into...
asked 18 minutes ago -
What is the cell potential of the following cell at 25
oC? Note Au is a...
asked 19 minutes ago -
DNA to Protein
Describe the mutation that created the HbS allele:
type of mutation, location of...
asked 25 minutes ago -
Which attribute allows you to specify a custom "thumbnail" for
multimedia elements?
asked 26 minutes ago -
1. Why are the advantages and disadvantages of object-oriented
databases? 2. What are data marts? How...
asked 44 minutes ago