hi, having trouble with these questions, please help me
out!
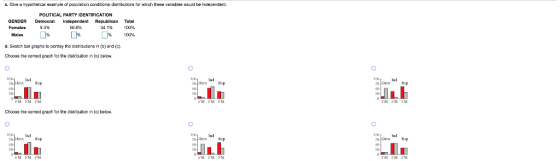
c. Give a hypother. ca exsmole of cooulaton corditiona distributione for which these variablee would be independent. POLTICAL PARTY IDENTIFICATION GENDER Demoerat Independent Republican Total 34.1% 100% MalesD- D- 0% 100% d. Seetch bar graphs to pertray the cistriautons in () and (a). Choose the corect grah for the distrbutien in (o) below. ndgop Choose the corect graph for the distrbutien in (e below. dgop
Homework Answers
Add Answer to:
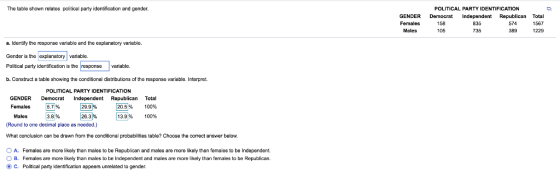
hi, having trouble with these questions, please help me out! The table shown relates political party identification and gender POLITICAL PARTY IDENTIFICATION GENDER Democrat Independent Republican To...
This Question: 10 pts 1 of 5 complete This Quiz: 25 pts possible o Is there...
 This Question: 10 pts 1 of 5 complete This Quiz: 25 pts possible o Is there an association between party allation and gender? The accompanying data represent the gender and party affiliation of registered voters based on a random sample of 607 adults. Complete parts (a) through in click the icon to view the disable (4) Construct a frequency marginal distribution Gender Political Party Female Frequency Marginal Male Distribution for Gender Republican 120 Democrat 150 103 Independent 150 179 Frequency...
Congress is made up of the house of representatives and the senate- Please help with questions...
 Congress is made up of the house of representatives and the
senate-
Please help with questions 5, 6, 7 and 8:
Congress is made up of the House of Representatives and the Senate. Members of the House of Representatives serve two-year terms and represent a district in a state. The number of representatives for each state is determined by population. States with larger populations have more representatives than states with smaller pulations. The total number of representatives is set by...
Congress is made up of the house of representatives and the
senate-
Please help with questions 5, 6, 7 and 8:
Congress is made up of the House of Representatives and the Senate. Members of the House of Representatives serve two-year terms and represent a district in a state. The number of representatives for each state is determined by population. States with larger populations have more representatives than states with smaller pulations. The total number of representatives is set by...
Please do all questions... Six hundred registered voters were surveyed and asked their political affiliation and...
 Please do all questions...
Six hundred registered voters were surveyed and asked their political affiliation and whether they support the idea of the Federal Government investing a portion of their social security contributions in the stock market. A summary of the survey is given in the table. If a voter is selected at random, what is the probability that the voter is a republican? Political Affiliation Republican Response Democrat Independent Totals Yes 35 90 10 135 No 165 100 200...
Please do all questions...
Six hundred registered voters were surveyed and asked their political affiliation and whether they support the idea of the Federal Government investing a portion of their social security contributions in the stock market. A summary of the survey is given in the table. If a voter is selected at random, what is the probability that the voter is a republican? Political Affiliation Republican Response Democrat Independent Totals Yes 35 90 10 135 No 165 100 200...
help please!!! The following table gives the number (lin millions) of men and women over the age of 24 at each level of educational attainment Did not College a Total Completed Some Gende...
 help please!!!
The following table gives the number (lin millions) of men and women over the age of 24 at each level of educational attainment Did not College a Total Completed Some Gender complete high school college graduate high school Males 12.9 15.9 96.3 30.7 90.8 128 41.31037 103.7 Females 12.8 25.7 31.8 17.8 200 62.5 78.1 Total 33.7 A What is the probability that a randomly selected person over the age of 24 did not complete high school?(answer with...
help please!!!
The following table gives the number (lin millions) of men and women over the age of 24 at each level of educational attainment Did not College a Total Completed Some Gender complete high school college graduate high school Males 12.9 15.9 96.3 30.7 90.8 128 41.31037 103.7 Females 12.8 25.7 31.8 17.8 200 62.5 78.1 Total 33.7 A What is the probability that a randomly selected person over the age of 24 did not complete high school?(answer with...
 This Question: 10 pts 1 of 5 complete This Quiz: 25 pts possible o Is there an association between party allation and gender? The accompanying data represent the gender and party affiliation of registered voters based on a random sample of 607 adults. Complete parts (a) through in click the icon to view the disable (4) Construct a frequency marginal distribution Gender Political Party Female Frequency Marginal Male Distribution for Gender Republican 120 Democrat 150 103 Independent 150 179 Frequency...
 Congress is made up of the house of representatives and the
senate-
Please help with questions 5, 6, 7 and 8:
Congress is made up of the House of Representatives and the Senate. Members of the House of Representatives serve two-year terms and represent a district in a state. The number of representatives for each state is determined by population. States with larger populations have more representatives than states with smaller pulations. The total number of representatives is set by...
Congress is made up of the house of representatives and the
senate-
Please help with questions 5, 6, 7 and 8:
Congress is made up of the House of Representatives and the Senate. Members of the House of Representatives serve two-year terms and represent a district in a state. The number of representatives for each state is determined by population. States with larger populations have more representatives than states with smaller pulations. The total number of representatives is set by...
 Please do all questions...
Six hundred registered voters were surveyed and asked their political affiliation and whether they support the idea of the Federal Government investing a portion of their social security contributions in the stock market. A summary of the survey is given in the table. If a voter is selected at random, what is the probability that the voter is a republican? Political Affiliation Republican Response Democrat Independent Totals Yes 35 90 10 135 No 165 100 200...
Please do all questions...
Six hundred registered voters were surveyed and asked their political affiliation and whether they support the idea of the Federal Government investing a portion of their social security contributions in the stock market. A summary of the survey is given in the table. If a voter is selected at random, what is the probability that the voter is a republican? Political Affiliation Republican Response Democrat Independent Totals Yes 35 90 10 135 No 165 100 200...
 help please!!!
The following table gives the number (lin millions) of men and women over the age of 24 at each level of educational attainment Did not College a Total Completed Some Gender complete high school college graduate high school Males 12.9 15.9 96.3 30.7 90.8 128 41.31037 103.7 Females 12.8 25.7 31.8 17.8 200 62.5 78.1 Total 33.7 A What is the probability that a randomly selected person over the age of 24 did not complete high school?(answer with...
help please!!!
The following table gives the number (lin millions) of men and women over the age of 24 at each level of educational attainment Did not College a Total Completed Some Gender complete high school college graduate high school Males 12.9 15.9 96.3 30.7 90.8 128 41.31037 103.7 Females 12.8 25.7 31.8 17.8 200 62.5 78.1 Total 33.7 A What is the probability that a randomly selected person over the age of 24 did not complete high school?(answer with...
Most questions answered within 3 hours.
-
An empty test tube weighs 15.923 grams. Then,
MgCl2•6H2O is added into the test tube. After...
asked 43 minutes ago -
Please answer true or false. Words
cannot be changed or added in to make it true...
asked 41 minutes ago -
(a) A piston at 6.1 atm contains a gas that occupies a volume of
3.5 L....
asked 42 minutes ago -
Assume memory access is 10 units of time and disk access is
10000 units of time....
asked 1 hour ago -
1. Are all good samples random?
2. Magazines often report surveys giving statistics such as “63%...
asked 1 hour ago -
Under all the various types of market structures, firms
must eventually earn some economic profits for...
asked 1 hour ago -
Consider the following fitness regime for a single locus trait
with two co-dominant alleles: w11 =...
asked 1 hour ago -
A large cable company reports the following.
80% of its customers subscribe to its cable TV...
asked 1 hour ago -
Please answer the question in brief.
Discuss the role of ERP in organizations. Are ERP tools...
asked 1 hour ago -
Discuss the pros and cons of collaborative software such
as SameTime. Does it increase productivity? What...
asked 1 hour ago -
Buying your in-laws a gift because it’s expected is
due to the ____________ motive of gift-giving....
asked 1 hour ago -
Calculate the expected value, the variance, and the standard
deviation of the given random variable X....
asked 2 hours ago