STATISTICS. CONFIDENCE REGIONS.
Let 


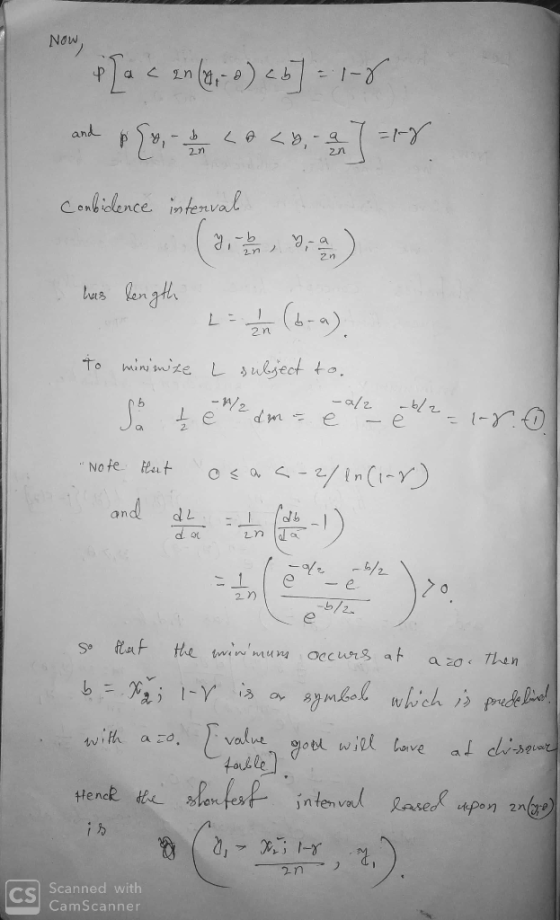
Find the confidence interval of minimum amplitude based on a sufficient statistic.
Thank you for your explanations.
f (x | θ) = e--(1-9)
Homework Answers
I am not sure about what does it mean by minimum amplitude.. I
have assumed that it's asking for finding confidence interval for
parameter. However go through my solution.. 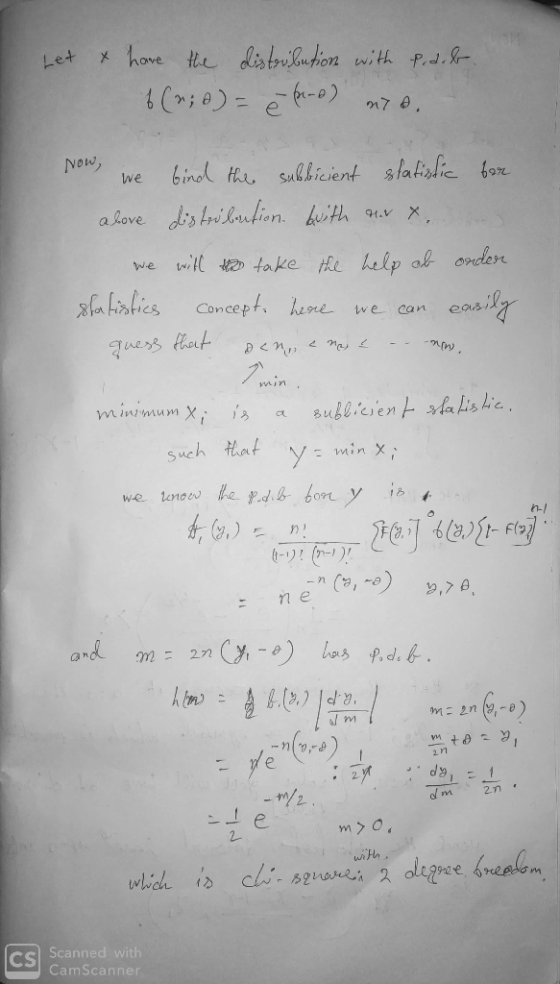
Add Answer to:
STATISTICS. CONFIDENCE REGIONS. Let be a simple random sample of a population with density function , , Find the confidence interval of minimum amplitude based on a sufficient statistic. Thank you...
STATISTICS. CONFIDENCE REGIONS. Let be a simple random sample of the density , . ...
STATISTICS. CONFIDENCE REGIONS. Let be a simple random sample of the density , . Find a confidence interval of 95% for the mean of the population.. Thank you for your explanations. We were unable to transcribe this imageWe were unable to transcribe this imageWe were unable to transcribe this imageWe were unable to transcribe this image
STATISTICS. REGIONS OF CONFIDENCE Let be a simple random sample (n) of the density , Find...
STATISTICS. REGIONS OF CONFIDENCE Let be a simple random sample (n) of the density , Find the confidence interval of 95% for the variance of the population. Thank you for your explanations. We were unable to transcribe this imageWe were unable to transcribe this imageWe were unable to transcribe this image
STATISTICS Let a random simple sample of a random variable with density function , Calculate, ...
STATISTICS Let a random simple sample of a random variable with density function , Calculate, for , a maximum likelihood estimator , and determine if it is a consistent estimator. Thank you for your explanations. We were unable to transcribe this imagef (x | θ) = e--(1-9) We were unable to transcribe this imageWe were unable to transcribe this image f (x | θ) = e--(1-9)
STATISTICS Let be a simple random sample of a given random variable with density function , ,...
STATISTICS Let be a simple random sample of a given random variable with density function , , , Calculate a sufficient statistic for and an unbiased estimator for which is function of the previous sufficient statistic. Thank you for your explanations We were unable to transcribe this imageWe were unable to transcribe this imageWe were unable to transcribe this imageWe were unable to transcribe this imageWe were unable to transcribe this imageWe were unable to transcribe this imageWe were unable...
STATISTICS. CONFIDENCE INTERVALS. Let be a simple randon sample of a population with distributi...
STATISTICS. CONFIDENCE INTERVALS. Let be a simple randon sample of a population with distribution . Construct a credible region with probability 0.95 for the mean , if it is assumed that initial distribution for is . Thank you for your explanations. We were unable to transcribe this imageWe were unable to transcribe this imageWe were unable to transcribe this imageWe were unable to transcribe this imageWe were unable to transcribe this imageWe were unable to transcribe this image
Let be a simple random sample of a random variable X with density function , . Given...
 Let
be a simple random sample of a random variable X with density
function
, .
Given the statistic :
Calculate a statistic ( function of ) such that its espected
value is equal to
.
Thank you for your explanations
We were unable to transcribe this imageWe were unable to transcribe this imageWe were unable to transcribe this imageに! We were unable to transcribe this imageWe were unable to transcribe this image
Let
be a simple random sample of a random variable X with density
function
, .
Given the statistic :
Calculate a statistic ( function of ) such that its espected
value is equal to
.
Thank you for your explanations
We were unable to transcribe this imageWe were unable to transcribe this imageWe were unable to transcribe this imageに! We were unable to transcribe this imageWe were unable to transcribe this image
POINT ESTIMATION Let be a simple random sample of a population , with , and let...
POINT ESTIMATION Let be a simple random sample of a population , with , and let be a known integer , . Find the MVUE ( minimum-variance unbiased estimator ) for the function of : Thank you for the explanations. X1, X2,..,X n Ber (0 E (0, 1) We were unable to transcribe this imageWe were unable to transcribe this imageWe were unable to transcribe this imaged (0) -s (1 - 0)" X1, X2,..,X n Ber (0 E (0, 1)...
Let be a random sample from . Show that the statistics is a sufficient statistics for...
Let be a random sample from . Show that the statistics is a sufficient statistics for . We were unable to transcribe this imageWe were unable to transcribe this imageWe were unable to transcribe this imageWe were unable to transcribe this image
Let {} be a random sample from the distribution. (a) Find a sufficient statistic for when...
Let {} be a random sample from the distribution. (a) Find a sufficient statistic for when is known (b) Find a sufficient statistic for when is known 7l beta ( α , β ) We were unable to transcribe this imageWe were unable to transcribe this imageWe were unable to transcribe this imageWe were unable to transcribe this image
3. Let ,..., be independent random sample from N(), where is unknown. (i) Find a sufficient...
 3. Let ,..., be
independent random sample from N(),
where is unknown.
(i) Find a sufficient statistic of .
(ii) Find the MLE of .
(iii) Find a pivotal quantity and use it to construct a
100(1–)% confidence
interval for .
We were unable to transcribe this imageWe were unable to transcribe this imageWe were unable to transcribe this imageWe were unable to transcribe this imageWe were unable to transcribe this imageWe were unable to transcribe this imageWe were unable...
3. Let ,..., be
independent random sample from N(),
where is unknown.
(i) Find a sufficient statistic of .
(ii) Find the MLE of .
(iii) Find a pivotal quantity and use it to construct a
100(1–)% confidence
interval for .
We were unable to transcribe this imageWe were unable to transcribe this imageWe were unable to transcribe this imageWe were unable to transcribe this imageWe were unable to transcribe this imageWe were unable to transcribe this imageWe were unable...
 Let
be a simple random sample of a random variable X with density
function
, .
Given the statistic :
Calculate a statistic ( function of ) such that its espected
value is equal to
.
Thank you for your explanations
We were unable to transcribe this imageWe were unable to transcribe this imageWe were unable to transcribe this imageに! We were unable to transcribe this imageWe were unable to transcribe this image
Let
be a simple random sample of a random variable X with density
function
, .
Given the statistic :
Calculate a statistic ( function of ) such that its espected
value is equal to
.
Thank you for your explanations
We were unable to transcribe this imageWe were unable to transcribe this imageWe were unable to transcribe this imageに! We were unable to transcribe this imageWe were unable to transcribe this image
 3. Let ,..., be
independent random sample from N(),
where is unknown.
(i) Find a sufficient statistic of .
(ii) Find the MLE of .
(iii) Find a pivotal quantity and use it to construct a
100(1–)% confidence
interval for .
We were unable to transcribe this imageWe were unable to transcribe this imageWe were unable to transcribe this imageWe were unable to transcribe this imageWe were unable to transcribe this imageWe were unable to transcribe this imageWe were unable...
3. Let ,..., be
independent random sample from N(),
where is unknown.
(i) Find a sufficient statistic of .
(ii) Find the MLE of .
(iii) Find a pivotal quantity and use it to construct a
100(1–)% confidence
interval for .
We were unable to transcribe this imageWe were unable to transcribe this imageWe were unable to transcribe this imageWe were unable to transcribe this imageWe were unable to transcribe this imageWe were unable to transcribe this imageWe were unable...
Most questions answered within 3 hours.
-
The free energy change for the following reaction at 25 °C, when
[Sn2+] = 1.17 M...
asked 9 seconds from now -
An MNE is this kind of industry when competition in one country
is essentially independent of...
asked 1 hour ago -
. For this set of questions, determine what
proportion of a normal distribution is located betweeneach...
asked 2 hours ago -
A college student is employed as a door-to-door newspaper
salesman. Historical data suggests that the student...
asked 3 hours ago -
MATLAB HW 11 problem using Switch Case and Input commands
Write a script file that calculates...
asked 2 hours ago -
Considering gravitational time dilation, calculate the time that
passes in Earth’s surface while 1 hour passes...
asked 3 hours ago -
Minitab Problem: Take the Lake Hume June rainfall data and find
use the processes outlined in...
asked 4 hours ago -
X Company is trying to decide whether to continue using old
equipment to make Product A...
asked 4 hours ago -
IN PYTHON ONLY !! Program 2: Re-work
program #5 (WeeklyHours) from the previous assignment such that...
asked 4 hours ago -
The average length of time between arrivals at a turnpike
toll-booth is 26 seconds. What is...
asked 6 hours ago -
(a) A piston at 6.1 atm contains a gas that occupies a volume of
3.5 L....
asked 7 hours ago -
Please answer true or false. Words
cannot be changed or added in to make it true...
asked 7 hours ago