
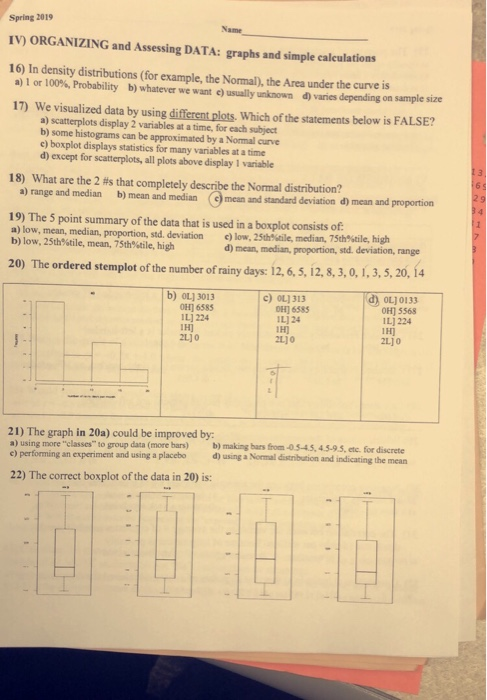
Spring 2019 Name IV) ORGANIZING and Assessing DATA: graphs and simple calculations 16) In density distributions (for example, the Normal), the Area under the curve is a) l or 100% Probability b) whatever we want e) usually unknown d) varies depending on sample size 17) We visualized data by using different plots. Which of the statements below is a) scatterplots display 2 variables at a time, for each subject b) some histograms can be approximated by a Normal curve c) boxplot displays statistics for many variables at a time d) except for scatterplots, all plots above display 1 variable FALSE? 18) What are the 2 #s that completely describe the Normal distribution? a) range and median b) mean and median (mean and standard deviation d) mean and proportion 19) The 5 point summary of the data that is used in a boxplot consists of a) low, mean, median, proportion, sid, deviation c) low, 25th-stile, median, 75th%tile, high b) low, 25th%tile, mean, 75th%tile, high d) mean, median, proportion, std. deviation, range 1, 3, 5, 20, 14 20) The ordered stemplot of the mumber of rainy dapys 12, 6.5, 12,s,3,0, d) oLj0133 OH) 5568 1U224 IH] 2L]0 c) OL) 313 0H) 6585 IL] 24 IH) 2110 b) OL] 3013 0H] 6585 IL]224 IH] 21) The graph in 20a) could be improved by to group data (more bars) b) making bars from-03-4.5, 45-9.5, etc. for discrete d) using a Normal distribution and indicating the mean c) performing an experiment and using a placebo 22) The correct boxplot of the data in 20) is:
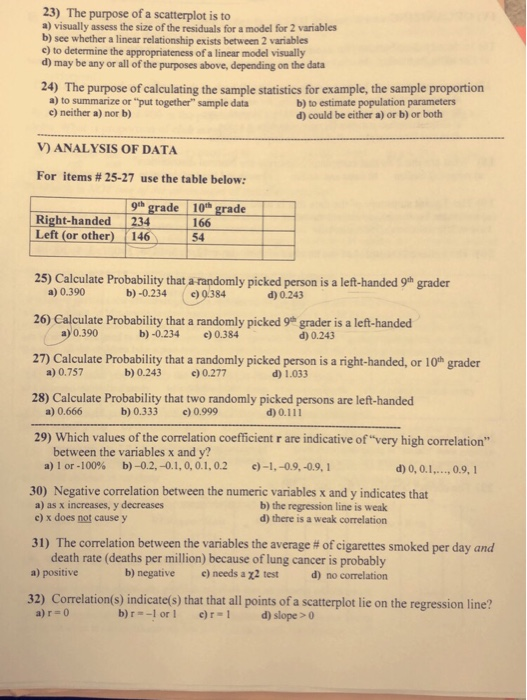
23) The purpose of a scatterplot is to a) visually assess the size of the residuals for a model for 2 variables b) see whether a linear relationship exists between 2 variables c) to determine the appropriateness of a linear model visually d) may be any or all of the purposes above, depending on the data 24) The purpose of calculating the sample statistics for example, the sample proportion a) to summarize or "put together" sample data e) neither a) nor b) b) to estimate population parameters d) could be either a) or b) or both V) ANALYSIS OF DATA For items # 25-27 use the table below: 9th grade 10h grade Right-handed 234166 Left (or other) 46 | 54 25) Calculate Probability that a-randomly picked person is a left-handed 9h grader 9) 0.390 b) -0.234 0384 0243 26) Calculate Probability that a randomly picked 9* grader is a left-handed 20.390 d) 0.243 b)-0.234 0.384 d) 0.243 27) Calculate Probability that a randomly picked person is a right-handed, or 10th grader b)0.243 a) 0.757 c)0.277 d) 1.033 28) Calculate Probability that two randomly picked persons are left-handed a) 0.666 b) 0.333 )0.999 d) 0.111 29) Which values of the correlation coefficient r are indicative of "very high correlation" between the variables x and y? a)lor-100% b)-02,-01, 0, 0.1, 0.2 c)-I,-09,-09, 1 d) 0, 0.1... 0.9,1 30) Negative correlation between the numeric variables x and y indicates that a) as x increases, y decreases c) x does not cause y b) the regression line is weak d) there is a weak corelation e correlation between the variables the average # of cigarettes smoked per day and 31) Th death rate (deaths per million) because of lung cancer is probably a) positive b) negative c) needs a z2 test d) no correlation 32) Correlation(s) indicate(s) that that all points of a scatterplot lie on the regression line? d)slope > 0 a) r 0 b)r=-1 or 1 e) r-1
Homework Answers
8) b. Stratified sampling ---- Since all the schools are stratified into various stratas. Out of those certain are randomly sampled from which again departments are randomly sampled and in the end teachers are randomly sampled.
9(4)) b. 
10(5)) c. Such random samples save time and money, compared to other types of random and systematic samples. -- Simple random samples and systematic samples are much more cost and time effective compared to stratified sampling.
11) a. a placebo-controlled study -- since one part of the random sample was subjected to ASI program and the other part was subjected to take regular 1st grade mathematics.
According to HOMEWORKLIB POLICY we are instructed to answer first 4 questions.
Add Answer to:
TEST 1: ANSWERS INTS EACH). This section takes around 5 minutes. Name Spring 2019 8) A researcher wants to determine whether female teachers give higher or lower grades, on average, then male t...
SECTION A- Multiple-choice questions. [30 marks] Answer all the questions from this section. Choose the correct...
SECTION A- Multiple-choice questions. [30 marks] Answer all the questions from this section. Choose the correct answers from the best alternatives given below. 1. What does sampling mean in research______________________. A. Identify people suitable for research B. Sampling using your intelligence guess C. Sampling people, a population D. is a given number of subjects from a defined population which is representative of it 2. When a number of researchers use the same operational definition to achieve the same result, this...
Most questions answered within 3 hours.
-
A light aircraft has a weight of 10kN. The weight of the pilot
and passengers is...
asked 4 minutes ago -
Jennifer invested $3,000 in her savings account for 5 years. When
she withdrew it, she had...
asked 14 minutes ago -
Columbus Manufacturing's stock currently sells for $ 28.60 a
share. The stock just paid a dividend...
asked 32 minutes ago -
what mass of sugar would have to be dissolved in 60g of water to
yield a...
asked 19 minutes ago -
1.
Consider the following standard reduction potentials,
Pb 2 +(aq) + 2 e- →
Pb(s) E°...
asked 20 minutes ago -
The demand for DVD players have declined significantly since
2007. Consumers are more interested in streaming...
asked 25 minutes ago -
Define the word and then write one personal sentence to
demonstrate your understanding by accurately using...
asked 21 minutes ago -
When aqueous solutions of potassium cyanide and hydrochloric
acid are mixed, an aqueous solution of potassium...
asked 23 minutes ago -
Research the essential ideas/assumptions of the classical and
neo-classical economic schools pertaining to international
trade.
asked 24 minutes ago -
We Pay Insurance Co. will pay you $1,450 each quarter for 27
years. You want to...
asked 28 minutes ago -
The A&M Hobby Shop carries a line of radio-controlled model
racing cars. Demand for the cars...
asked 31 minutes ago -
Suppose you have three events - X, Y, and Z - where X and Y are...
asked 54 minutes ago