please answer all the question and print matlab code You need to design bandpass filter with lower cutoff freq. of 1000Hz and upper cutoff freq. of 3000Hz. Sampling freq. 10000Hz. Plot the freq. respo...
please answer all the question and print matlab code
You need to design bandpass filter with lower cutoff freq. of 1000Hz and upper cutoff freq. of 3000Hz. Sampling freq. 10000Hz. Plot the freq. response in DB .Use MATLAB as needed
a) FIR with Hamming window at least 7 taps
b) IIR using Bilinear Transformation method not more than 2end order.
c) Compare the frequency response “freqz” plots and which method you recommend and why? 2 graphs on this part.
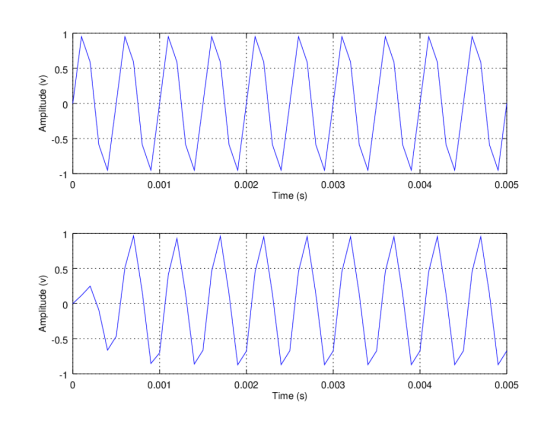
d) Determine the output of the filters for sinusoidal input with frequency 500Hz and 2000Hz for both filters. You may use the “filter” command. 4 graphs on this part. This will give time domain response.
Homework Answers
The specifications are as follows:
lower cutoff freq = f1 = 1000 Hz
upper cutoff freq = f2 = 3000 Hz
Sampling freq = fs = 10000 Hz
----------------------------------------------------------------------------------------------------------------------------------------------------
MATLAB code for all the four subsections is written below,
---------- START OF MATLAB CODE ---------------------
%------------------------------------------
% FIR with Hamming window
%------------------------------------------
% Lower cutoff freq
f1 = 1000; % f1 = 1000 Hz
% Upper cutoff freq
f2 = 3000; % f2 = 3000 Hz
% Sampling freq
fs = 10000; % fs = 10000 Hz
% Normalized lower and upper cutoff frequencies
w1 = f1/fs;
w2 = f2/fs;
% Creation of FIR filter with Hamming window
N = 7; % Atleast 7 taps of Hamming window
bf = fir1(N,[w1,w2],'bandpass','hamming');
% Frequency response of FIR Hamming window
figure,freqz(bf,1,500,fs)
grid on;
%---------------------------------------
% IIR with bilinear transformation
%---------------------------------------
% Order of the filter
n = 2;
% Cut-off frequencies in radians per second
w1 = 2*pi*f1;
w2 = 2*pi*f2;
% Butterworth filter in 's'
[num,den] = butter(n, [w1, w2], 's');
% Applying bilinear transform
[bi,ai] = bilinear(num, den, 1/fs);
% Frequency response of IIR filter
figure,freqz(bi,ai,500,fs);
grid on;
%----------------------------------
% Time domain analysis for 500 Hz
%----------------------------------
% Frequency
ft = 500; % 500Hz
% Time for 10 cycles
T = 10/ft;
% Time sequence to construct signal for time domain analysis
t = 0:1/fs:T;
% Generation of signal of 500 Hz
x = sin(2*pi*ft*t);
% Filter signal using FIR filter
xf = filter(bf,1,x);
% Plotting the signal
figure,subplot(2,1,1),plot(t,x),grid on,xlabel('Time
(s)'),ylabel('Amplitude (v)'),hold on
subplot(2,1,2),plot(t,xf),xlabel('Time (s)'),ylabel('Amplitude
(v)'),grid on
% Filter signal using IIR filter
xi = filter(bi,ai,x);
% Plotting the signal
figure,subplot(2,1,1),plot(t,x),grid on,xlabel('Time
(s)'),ylabel('Amplitude (v)'),hold on
subplot(2,1,2),plot(t,xi),xlabel('Time (s)'),ylabel('Amplitude
(v)'),grid on
%----------------------------------
% Time domain analysis for 2000 Hz
%----------------------------------
% Frequency
ft = 2000; % 500Hz
% Time for 10 cycles
T = 10/ft;
% Time sequence to construct signal for time domain analysis
t = 0:1/fs:T;
% Generation of signal of 2000 Hz
x = sin(2*pi*ft*t);
% Filter signal using FIR filter
xf = filter(bf,1,x);
% Plotting the signal
figure,subplot(2,1,1),plot(t,x),grid on,xlabel('Time
(s)'),ylabel('Amplitude (v)'),hold on
subplot(2,1,2),plot(t,xf),xlabel('Time (s)'),ylabel('Amplitude
(v)'),grid on
% Filter signal using IIR filter
xi = filter(bi,ai,x);
% Plotting the signal
figure,subplot(2,1,1),plot(t,x),grid on,xlabel('Time
(s)'),ylabel('Amplitude (v)'),hold on
subplot(2,1,2),plot(t,xi),xlabel('Time (s)'),ylabel('Amplitude
(v)'),grid on
---------- END OF MATLAB CODE -----------------------
Each command line is accompanied with a comment. Save the code in a single MATLAB file as 'analyze.m' and run the command 'analyze' in MATLAB command window. All the figures are generated as required in the problems.
----------------------------------------------------------------------------------------------------------------------------------------------------
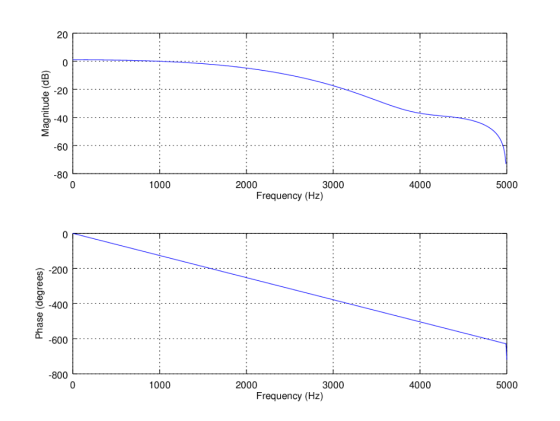
a) FIR Hamming window frequency response is shown below,
----------------------------------------------------------------------------------------------------------------------------------------------------
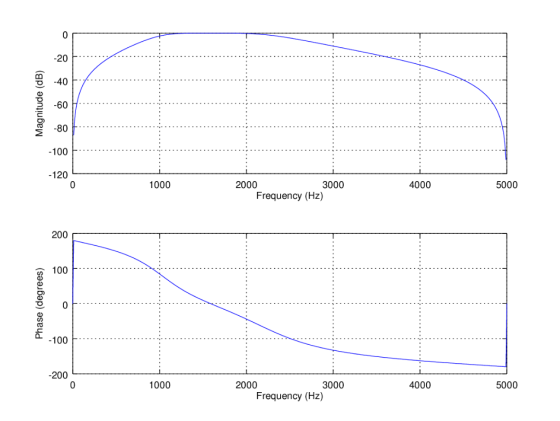
b) IIR bilinear transformation with second order butterworth filter frequency response is shown below,
----------------------------------------------------------------------------------------------------------------------------------------------------
c) The above frequency response plots were generated using 'freqz' command. If we observe the frequency response plots and especially the phase response. The phase response is linearly increasing for FIR filter, where as IIR filter has varying phase for different frequencies. Phase response is important to preserve the shape of the signal. If the phase is linearly varying then the shape of the signal doesn't distort. Hence, FIR filter is butter than the IIR filter.
----------------------------------------------------------------------------------------------------------------------------------------------------
d) (1) Time domain analysis of 500 Hz using FIR filter.
The time domain plot is shown below,
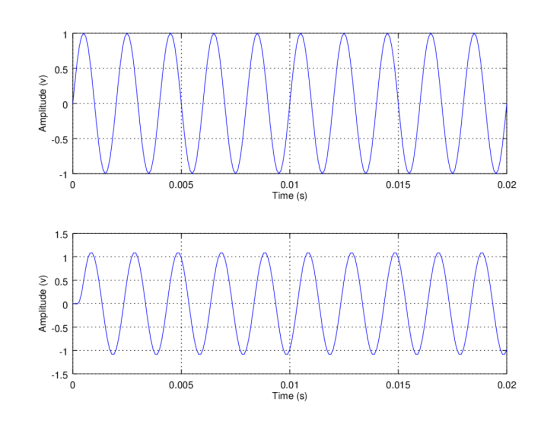
(2) Time domain analysis of 500 Hz using IIR filter.
The time domain plot is shown below,

(3) Time domain analysis of 2000 Hz using FIR filter.
The time domain plot is shown below,
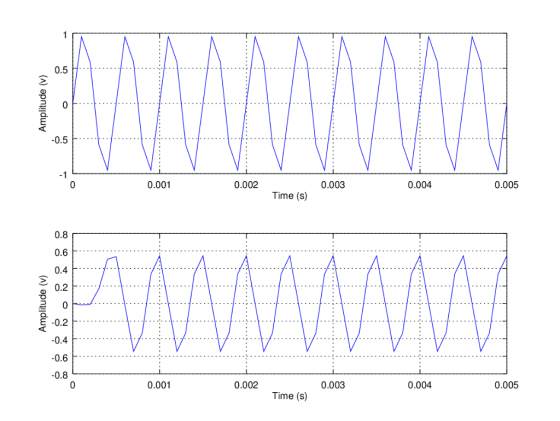
(4) Time domain analysis of 2000 Hz using IIR filter.
The time domain plot is shown below,
----------------------------------------------------------------------------------------------------------------------------------------------------
Note: For 2000 Hz signal, there are four distinct segments in the input generated signal.
We can see FIR filtered signal has similar four distinct segments. But, we cannot see all the four segments in IIR filtered signal. So, the shape of the signal is distorted when filtered with IIR filter.
============================================================
Add Answer to:
please answer all the question and print matlab code You need to design bandpass filter with lower cutoff freq. of 1000Hz and upper cutoff freq. of 3000Hz. Sampling freq. 10000Hz. Plot the freq. respo...
matlab code as well please. 7. (100) Design a bandpass FIR filter with the following Spec:...
 matlab code as well please.
7. (100) Design a bandpass FIR filter with the following Spec: (a) Lower cut off frequency: 1250Hz, (b) lower transition width: 1500Hz, (c) upper cutoff frequency: 2850 Hz, (d) upper transition width: 1300 Hz, (e) stop band attenuation: 60dB, (f) passband ripple 0.02 dB, and (g) sampling frequency: 8000Hz. Your answer needs to include (i) normalized frequencies, (ii) Window type, (iii) order of the filter and their numerical values computed by matlab command firwd(), and...
matlab code as well please.
7. (100) Design a bandpass FIR filter with the following Spec: (a) Lower cut off frequency: 1250Hz, (b) lower transition width: 1500Hz, (c) upper cutoff frequency: 2850 Hz, (d) upper transition width: 1300 Hz, (e) stop band attenuation: 60dB, (f) passband ripple 0.02 dB, and (g) sampling frequency: 8000Hz. Your answer needs to include (i) normalized frequencies, (ii) Window type, (iii) order of the filter and their numerical values computed by matlab command firwd(), and...
Most questions answered within 3 hours.
-
Write a program to solve the Josephus problem, with the following
modification:
Sample Input:
./a.out n...
asked 1 hour ago -
At the start of a CD it is spinning at a rate of 525 rpm
(revolutions...
asked 1 hour ago -
4. Without doing any calculations, predict whether the observed
∆T would increase, decrease or remain the...
asked 2 hours ago -
Based on the range, which of the following sets of scores has
the greatest variability? 3,...
asked 4 hours ago -
Ripples in a pond travel at a velocity of 3 m/s with one peak
passing a...
asked 3 hours ago -
A man stands on the roof of a building of height 13.0 mm and
throws a...
asked 4 hours ago -
The extent to which assets are financed by borrowed funds and
other liabilities is indicated by:...
asked 5 hours ago -
Explain in detail
Germany is the fifth largest economy
explain what goods and services Germany specializes...
asked 5 hours ago -
The density of platinum is 21.45 g/mL. If a cube of platinum
with a mass of...
asked 5 hours ago -
Accounts Receivable
Sales
A/R Posting
Extended Sales Invoice
Packing Slip
Compare invoice to packing slip 2...
asked 5 hours ago -
Michaella, age 23, is a full-time law student and is claimed by
her parents as a...
asked 5 hours ago -
Why are polymers not typically casted into products?
asked 5 hours ago