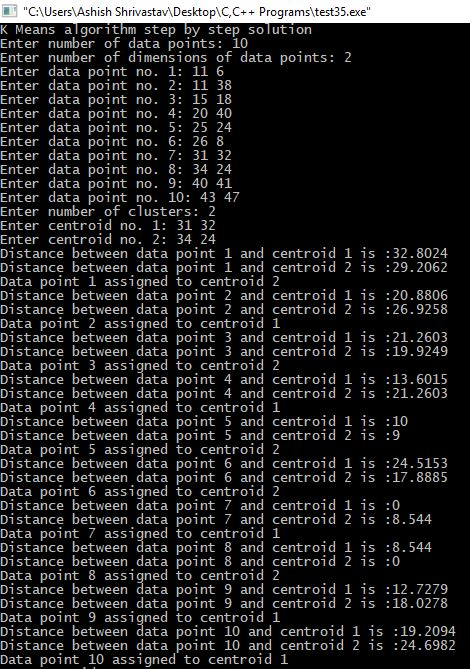
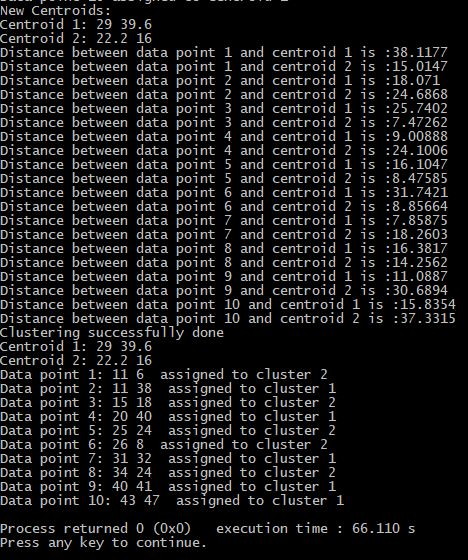
Question Given the following data points, use the K-Means algorithm to cluster them into 2 clusters. Use (31,32) as the centroid of the first cluster and (34,24) as the centroid of the second cluster....
Question
Given the following data points, use the K-Means algorithm to
cluster them into
2 clusters. Use (31,32) as the centroid of the first cluster and
(34,24) as the
centroid of the second cluster. Show your calculations and the
final clusters.
| 1 | 2 | 3 | 4 | 5 | 6 | 7 | 8 | 9 | 10 | |
| x | 11 | 11 | 15 | 20 | 25 | 26 | 31 | 34 | 40 | 43 |
| y | 6 | 38 | 18 | 40 | 24 | 8 | 32 | 24 | 41 | 47 |
Homework Answers
I have made a C++ PROGRAM that gives step by step solution to this problem.
The output gives all the calculations and shows the final clusters
Add Answer to:
Question Given the following data points, use the K-Means algorithm to cluster them into 2 clusters. Use (31,32) as the centroid of the first cluster and (34,24) as the centroid of the second cluster....
Given the following data points, use the K-Means algorithm to cluster them into 2 clusters. Use...
Given the following data points, use the K-Means algorithm to cluster them into 2 clusters. Use (31,32) as the centroid of the first cluster and (34,24) as the centroid of the second cluster. Show your calculations and the final clusters. 1 2 3 4 5 6 7 8 9 10 x 11 11 15 20 25 26 31 34 40 43 y 6 38 18 40 24 8 32 24 41 47
Consider the graph given above. Use Dijkstra's algorithm to find the shortest path between B and ...
 Consider the graph given above. Use Dijkstra's algorithm to find
the shortest path between B and O.
a. List the vertices in the order they are visited as specified
by the algorithm.
b. What is the total weight along the path?
52 41 G 26 14 H 12 50 35 44 15 9 47 8 37 38 42 29 H 32 51 30 19 46 48 43 18 34 17 0 13 F
52 41 G 26 14 H 12...
Consider the graph given above. Use Dijkstra's algorithm to find
the shortest path between B and O.
a. List the vertices in the order they are visited as specified
by the algorithm.
b. What is the total weight along the path?
52 41 G 26 14 H 12 50 35 44 15 9 47 8 37 38 42 29 H 32 51 30 19 46 48 43 18 34 17 0 13 F
52 41 G 26 14 H 12...
1. Implement the K-means algorithm using these two as a reference. 2.Use Matlab’s implementation of kmeans...
 1. Implement the K-means algorithm using these two as a
reference.
2.Use Matlab’s implementation of kmeans to check your results on
the fisheriris dataset
(https://www.mathworks.com/help/stats/kmeans.html)
a. The fisheriris dataset is built into Matlab, and you can load
it using ‘load fisheriris’.
b. Please note the labels are available for the dataset, so you
can check the performance of the kmeans algorithm on the
dataset.
274 14 Unsupervised Lnn Fig. 14.1 A two-dimensional domain with clusters of examples weight bot initial...
1. Implement the K-means algorithm using these two as a
reference.
2.Use Matlab’s implementation of kmeans to check your results on
the fisheriris dataset
(https://www.mathworks.com/help/stats/kmeans.html)
a. The fisheriris dataset is built into Matlab, and you can load
it using ‘load fisheriris’.
b. Please note the labels are available for the dataset, so you
can check the performance of the kmeans algorithm on the
dataset.
274 14 Unsupervised Lnn Fig. 14.1 A two-dimensional domain with clusters of examples weight bot initial...
Sample Data Sample Data Hour Sample Taken Hour Sample Taken 1 4 5 X 1 3...
 Sample Data Sample Data Hour Sample Taken Hour Sample Taken 1 4 5 X 1 3 1 42 2 3 4 5 6 2 39 36 25 60 28 53 22 56 41 34 43 45 59 42 36 40 45 39 48 26 42 34 61 48 45 29 3 31 61 38 40 54 26 38 42 37 41 53 37 47 41 37 29 20 26 43 38 33 37 37 35 33 36 41 25 37...
Magic Square question for Python
You have this solution in Java, I am interested in this same solution for Python.One interesting application of two-dimensional arrays is magic squares. A magic square is a square matrix in which the sum of every row, every column, and bothdiagonals is the same. Magic squares have been studied for many years, and there are some particularly famous magic squares. In this exercise you will write code todetermine whether a square is magic.You should find that the first, second, and...
Here are the data from a study in which adolescents were given counseling at the beginning...
Here are the data from a study in which adolescents were given counseling at the beginning of the school year to see if it had a positive impact on their tolerance for adolescents who were ethnically different from them. Assessments were made right before the treatment and then 6 months later. Did the program work? The outcome variable is scored on an attitude-toward-others test with possible scores ranging from 0 to 50; the higher the score, the more tolerance. Use...
1. Given the following physical addresses and value in memory: add 0 val 9 10 11 12 13 1415161181...
 1. Given the following physical addresses and value in memory: add 0 val 9 10 11 12 13 14151611819 2021 22 23 18 24 20 32 0 40 8 32 245458 10 36 34 3230 40 35 3028 add 24 25 26 27 28 29 30 31 32 33 34 | 35 | 36 37 38 39 40 | 41 | 42 | 43 44 45 46 47 8 40 35 1614 12 12 22 24417 21 23 25 27...
You are studying an invasive insect species in the USA. Understanding where invasive species comes from can help with management (e.g., importation of native natural enemies for biocontrol). The graph...
 You are studying an invasive insect species in the USA.
Understanding where invasive species comes from can help with
management (e.g., importation of native natural enemies for
biocontrol). The graph below shows output from a STRUCTURE analysis
of 10 microsatellite markers in 50 individuals taken from the
invasive US population, and the three native countries of origin,
Spain, France, and Italy. A-1pt) How many genetic groups, or
clusters, were identified in the analysis? Assuming you’ve completely
sampled the native range...
You are studying an invasive insect species in the USA.
Understanding where invasive species comes from can help with
management (e.g., importation of native natural enemies for
biocontrol). The graph below shows output from a STRUCTURE analysis
of 10 microsatellite markers in 50 individuals taken from the
invasive US population, and the three native countries of origin,
Spain, France, and Italy. A-1pt) How many genetic groups, or
clusters, were identified in the analysis? Assuming you’ve completely
sampled the native range...
느 - K L M N O Р Q R S B с D E F...
 느 - K L M N O Р Q R S B с D E F G H 4 A sample of households provided the following information about their Per Capita Income. 5 Use Excel to construct a percent frequency distribution table and graph. 6 Provide an appropriate label for each of the horizontal and vertical axes. 7 Make your first class "30,000-34,999" 8 Place the frequency distribution table and histogram within the highlighted box below. 9 Per Capita 10...
You are curious about whether you can enhance the ability to hear differences between nonnative speech...
You are curious about whether you can enhance the ability to hear differences between nonnative speech sounds when people learn a new language. You test your novel language training procedure on a group of 32 pariticipants using a pretest/posttest design. The pretest and the posttest measure performance as the number of correct trials out of 100. The data are shown on the right. Does the new language training procedure improve the perception of nonnative speech sounds? Number of correct items...
 Consider the graph given above. Use Dijkstra's algorithm to find
the shortest path between B and O.
a. List the vertices in the order they are visited as specified
by the algorithm.
b. What is the total weight along the path?
52 41 G 26 14 H 12 50 35 44 15 9 47 8 37 38 42 29 H 32 51 30 19 46 48 43 18 34 17 0 13 F
52 41 G 26 14 H 12...
Consider the graph given above. Use Dijkstra's algorithm to find
the shortest path between B and O.
a. List the vertices in the order they are visited as specified
by the algorithm.
b. What is the total weight along the path?
52 41 G 26 14 H 12 50 35 44 15 9 47 8 37 38 42 29 H 32 51 30 19 46 48 43 18 34 17 0 13 F
52 41 G 26 14 H 12...
 1. Implement the K-means algorithm using these two as a
reference.
2.Use Matlab’s implementation of kmeans to check your results on
the fisheriris dataset
(https://www.mathworks.com/help/stats/kmeans.html)
a. The fisheriris dataset is built into Matlab, and you can load
it using ‘load fisheriris’.
b. Please note the labels are available for the dataset, so you
can check the performance of the kmeans algorithm on the
dataset.
274 14 Unsupervised Lnn Fig. 14.1 A two-dimensional domain with clusters of examples weight bot initial...
1. Implement the K-means algorithm using these two as a
reference.
2.Use Matlab’s implementation of kmeans to check your results on
the fisheriris dataset
(https://www.mathworks.com/help/stats/kmeans.html)
a. The fisheriris dataset is built into Matlab, and you can load
it using ‘load fisheriris’.
b. Please note the labels are available for the dataset, so you
can check the performance of the kmeans algorithm on the
dataset.
274 14 Unsupervised Lnn Fig. 14.1 A two-dimensional domain with clusters of examples weight bot initial...
 Sample Data Sample Data Hour Sample Taken Hour Sample Taken 1 4 5 X 1 3 1 42 2 3 4 5 6 2 39 36 25 60 28 53 22 56 41 34 43 45 59 42 36 40 45 39 48 26 42 34 61 48 45 29 3 31 61 38 40 54 26 38 42 37 41 53 37 47 41 37 29 20 26 43 38 33 37 37 35 33 36 41 25 37...
 1. Given the following physical addresses and value in memory: add 0 val 9 10 11 12 13 14151611819 2021 22 23 18 24 20 32 0 40 8 32 245458 10 36 34 3230 40 35 3028 add 24 25 26 27 28 29 30 31 32 33 34 | 35 | 36 37 38 39 40 | 41 | 42 | 43 44 45 46 47 8 40 35 1614 12 12 22 24417 21 23 25 27...
 You are studying an invasive insect species in the USA.
Understanding where invasive species comes from can help with
management (e.g., importation of native natural enemies for
biocontrol). The graph below shows output from a STRUCTURE analysis
of 10 microsatellite markers in 50 individuals taken from the
invasive US population, and the three native countries of origin,
Spain, France, and Italy. A-1pt) How many genetic groups, or
clusters, were identified in the analysis? Assuming you’ve completely
sampled the native range...
You are studying an invasive insect species in the USA.
Understanding where invasive species comes from can help with
management (e.g., importation of native natural enemies for
biocontrol). The graph below shows output from a STRUCTURE analysis
of 10 microsatellite markers in 50 individuals taken from the
invasive US population, and the three native countries of origin,
Spain, France, and Italy. A-1pt) How many genetic groups, or
clusters, were identified in the analysis? Assuming you’ve completely
sampled the native range...
 느 - K L M N O Р Q R S B с D E F G H 4 A sample of households provided the following information about their Per Capita Income. 5 Use Excel to construct a percent frequency distribution table and graph. 6 Provide an appropriate label for each of the horizontal and vertical axes. 7 Make your first class "30,000-34,999" 8 Place the frequency distribution table and histogram within the highlighted box below. 9 Per Capita 10...
Most questions answered within 3 hours.
-
Suppose that XX is a random variable with mean 16 and standard
deviation 5 . Also...
asked 9 minutes ago -
Calculate the number density of argon gas at a temperature of
24C and a pressure of...
asked 3 hours ago -
Alternative
Classification
How to Estimate
Probabilities from Data? ( For continuous Attributes)
And How to generate...
asked 3 hours ago -
An explosion breaks a 20.0-kg object into three parts. The
object is initially moving at a...
asked 4 hours ago -
Calculate the approximate number of residues of Rubisco, which
is involved in carbon fixation in plants,...
asked 5 hours ago -
Other decisions about scientific claims can have a much broader
impact.ENERGYarrow-10x10.png, environment, health, security - all...
asked 6 hours ago -
I need to write a research paper and work cited about this
topic: The United States...
asked 6 hours ago -
Hello! I was wondering if I could have some help?
If the vapor pressure of carvone...
asked 6 hours ago -
An economist wants to estimate the mean per capita income (in
thousands of dollars) for a...
asked 7 hours ago -
What would be the input/output characteristic of a circuit
obtained by putting two of your 2's-complementers...
asked 7 hours ago -
In Drosophila, the transition from the syncytial blastoderm
stage to the cellular blastoderm stage is a...
asked 7 hours ago -
Project management question:
Name 3 different types of resources (hint: humans are one
type)
asked 7 hours ago