Question
Table 5-A.4 Ages of 61 Patients Discharged from DRG 127,
Heart Failure and Shock
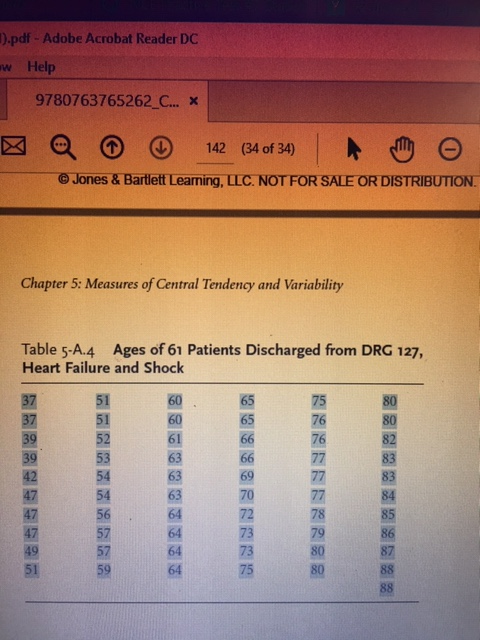
a. Use statistical software to calculate
the mean,median,mode,
variance, and standard devia-
Exercises for Solving Problems | 139
© Jones & Bartlett Learning, LLC. NOT FOR SALE OR DISTRIBUTION.
7532
tion for the ungrouped frequency
distribution and to
prepare a frequency table.
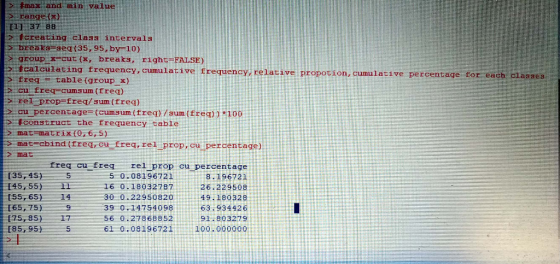
b. Group ages into class intervals.
Prepare a table that displays
the frequencies for each class
interval, the cumulative frequency,
the relative proportion,
and the cumulative percentage.
c. Compute the mean, median,
mode, variance, and standard
deviation for the grouped data.
d. Compare the results of the
grouped and ungrouped frequency
distributions.
Homework Answers
Answer #1

R RGui (32-bit) File Edit View Misc Packages Windows Help >:#user defined function to get node getmode < function (v) Lniqv<-unique (v) tuniqv [which.max (tabulate (match (v, unigv))) factual data c (37,37,39, 39, 42,47,47, 47,49, 51, 51, 51, 52, 53, 54, 54, 56,57,57, 59, 60, 60, 61,63, 63, 63,64,64, 64, 64,65, + 65, 66,66, 69,70, 72,73, 73, 75, 75,76, 76,77,77 77.78.79,8o,ao, 80, 30,82,83,83,84,85, 86,87,88, 83) > #finding mean, median, mode, variance, standard deviation of ungrouped data XF mean (x) :median (x):getmode (x) :var (x) sd (x) I11 65.57377 [11 65 [1] 64 [11 202.782 [11 14.24015 > #max and min value range (x) [11 37 88 >1 #creating class intervals breaks-seg (35,95, by 10) group x=cut (x, breaks, right=FALSE) > #calculating frequency, cumulative frequency, relative propotion, cumulative percentage for each classes freg table (group x) u freg cumsum (freq) i rel prop freg/sum (freq)
#max and min value 111 37 88 reating class intervals s breaks-geg (35, 95, by 10) group x-cut (x, breaks, right FALSE ting frequency, cumulative frequency relative propotion, cumulative percentage tor each classes freqtable(group x) cu freq cumsum (freq) rel prop-freq/sum (freq) cu percentagetcumsum (freq) /sum (freg)) 100 Fconstruct the frequency table mat-matrix (0, 6,5) mat cbind (freq, cu freq, rel prop, cu percentage) mat freq cu freg rel prop cu percentage 8 196721 16 0.1803278726.229508 [35, 45)5 145,55)11 [55, 65): 14 65,75)9 5 0.08196721 30 0.22950820 … 49.180328 39 0.14754098 56 0.2786885291 803279 61 0.08196721100.000000 175,85) 17 E85,95)5
Know the answer?
Add Answer to:
Table 5-A.4 Ages of 61 Patients Discharged from DRG 127, Heart Failure and Shock a. Use statistical software to calculate the mean,median,mode, variance, and standard devia- Exercises for Solving Pro...
Not the answer you're looking for?
Ask your own homework help question.
Our experts will answer your question WITHIN MINUTES for Free.
Similar Homework Help Questions
ADVERTISEMENT
Need Online Homework Help?
Ask
a QuestionGet Answers For Free
Most questions answered within 3 hours.
Most questions answered within 3 hours.
ADVERTISEMENT
ADVERTISEMENT
Active Questions
-
Write a program to solve the Josephus problem, with the following
modification:
Sample Input:
./a.out n...
asked 2 hours ago -
At the start of a CD it is spinning at a rate of 525 rpm
(revolutions...
asked 2 hours ago -
4. Without doing any calculations, predict whether the observed
∆T would increase, decrease or remain the...
asked 4 hours ago -
Based on the range, which of the following sets of scores has
the greatest variability? 3,...
asked 5 hours ago -
Ripples in a pond travel at a velocity of 3 m/s with one peak
passing a...
asked 5 hours ago -
A man stands on the roof of a building of height 13.0 mm and
throws a...
asked 5 hours ago -
The extent to which assets are financed by borrowed funds and
other liabilities is indicated by:...
asked 6 hours ago -
Explain in detail
Germany is the fifth largest economy
explain what goods and services Germany specializes...
asked 6 hours ago -
The density of platinum is 21.45 g/mL. If a cube of platinum
with a mass of...
asked 6 hours ago -
Accounts Receivable
Sales
A/R Posting
Extended Sales Invoice
Packing Slip
Compare invoice to packing slip 2...
asked 6 hours ago -
Michaella, age 23, is a full-time law student and is claimed by
her parents as a...
asked 6 hours ago -
Why are polymers not typically casted into products?
asked 6 hours ago
ADVERTISEMENT