3. Explain the level of measurement of each variable. 4. Calculate the percent in each cell and construct a percentage table based on your calculations. 5. Analyze the data in the percentage table in Step 4 and explain the relationship between the two variables.
Homework Answers
3. We find that the data is given in the form of Count / frequencies for each category. The given data has 2 variables namely,
a. Gender b.Support Higher tax To Reduce Pollution
with 2 and 3 categories respectively. Since, the variables are categorical, the level of measurement for both the variables would be "Nominal".
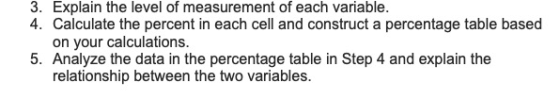
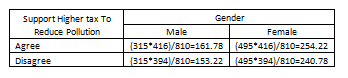
4. Computing the percentage in each cell, i.e. dividing the frequency in each cell by the Grand total = 315 + 495 = 810:
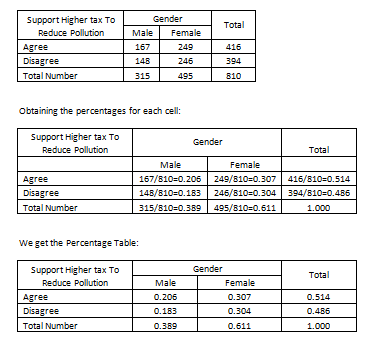
To find the gender wise probabilities, we divide each cell frequency by its corresponding column totals:
For cell 1: Probability = 167 / 315 = 0.53. We get the Probability table as:
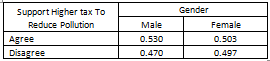
Looking at the percentages, little difference in the categories is observed. We might not have sufficient evidence to claim a significant relationship between the two variables.
5. To test whether there exist a significant relationship between the two (nominal) variables, we may go for a Chi square test of association.
To test: H0: No significant relation exist between Gender and opinion on whether they support Higher tax to Reduce pollution Vs Ha: A significant relation exist between Gender and their opinion on whether they support Higher tax to Reduce pollution.
The appropriate test statistic here, would be Chi Square, given by,

with critical region given by, 
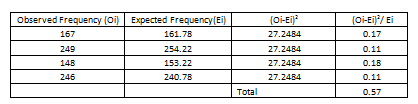
Where Oi = Observed Frequency and Ei = Expected frequency
Expected frequencies can be computed for each cell by obtaining the product of the corresponding row and column totals and dividing it by the Grand Total:
Substituting the values in the test statistic formula, we get
Comparing the test statistic obtained with its critical value
(Obtained from chi square tables for (No. of rows - 1)(No. of
Columns - 1) = (2-1)(2-1) = 1 degree of freedom, at say, 
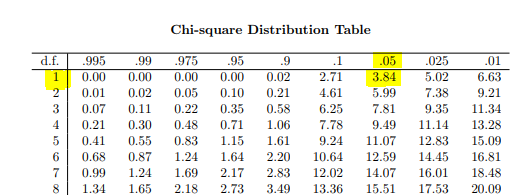
Since, 
We may conclude that, the given data does not provide sufficient evidence to claim that there exist a significant relation between Gender and their opinion on whether they support Higher tax to Reduce pollution.
Add Answer to:
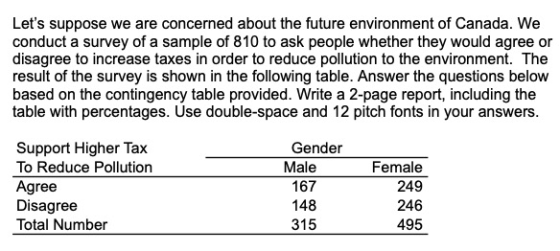
Let's suppose we are concerned about the future environment of Canada. We conduct a survey of a sample of 810 to ask people whether they would agree or disagree to increase taxes in order to redu...
Most questions answered within 3 hours.
-
Write a program to solve the Josephus problem, with the following
modification:
Sample Input:
./a.out n...
asked 2 hours ago -
At the start of a CD it is spinning at a rate of 525 rpm
(revolutions...
asked 2 hours ago -
4. Without doing any calculations, predict whether the observed
∆T would increase, decrease or remain the...
asked 3 hours ago -
Based on the range, which of the following sets of scores has
the greatest variability? 3,...
asked 5 hours ago -
Ripples in a pond travel at a velocity of 3 m/s with one peak
passing a...
asked 4 hours ago -
A man stands on the roof of a building of height 13.0 mm and
throws a...
asked 4 hours ago -
The extent to which assets are financed by borrowed funds and
other liabilities is indicated by:...
asked 5 hours ago -
Explain in detail
Germany is the fifth largest economy
explain what goods and services Germany specializes...
asked 6 hours ago -
The density of platinum is 21.45 g/mL. If a cube of platinum
with a mass of...
asked 6 hours ago -
Accounts Receivable
Sales
A/R Posting
Extended Sales Invoice
Packing Slip
Compare invoice to packing slip 2...
asked 6 hours ago -
Michaella, age 23, is a full-time law student and is claimed by
her parents as a...
asked 6 hours ago -
Why are polymers not typically casted into products?
asked 6 hours ago