
Homework Answers
a) It is correct to choose one sample t-test because the sample is taken from a large population and the plot also show that the distribution is approximately normal and hence assumed as normal distribution but the sample size is less than 30 so t- distribution is assumed .
b) No, because the box plot appears a normally distributed from naked eye view and also the median is around 240 so, we cannot say that the mean differs from 240.
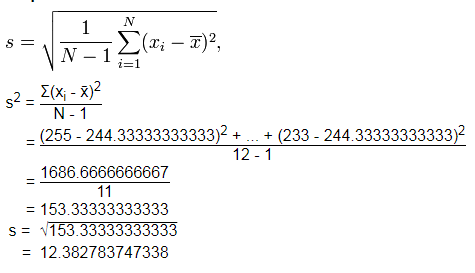
c) Since the mean is calculated as


and Sample standard deviation is calculated as
The Hypotheses are


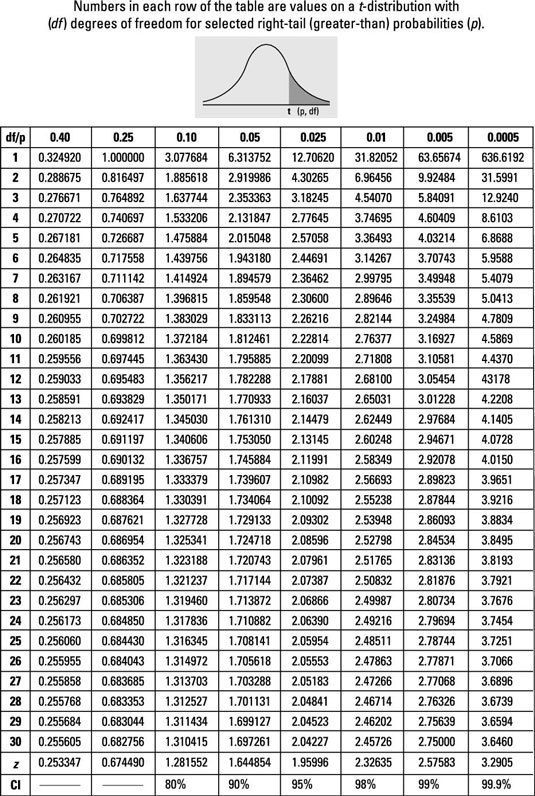
Significance level is assumed as 0.05 since it is not given in ques
rejection region:
Reject Ho if |T| >t 0.05, 11 =2.20 , where 11= degree of freedom =n-1=12-1=11
Test statistic:

P-value:
P-value associated with t Score calculated above as
0.1<p-value<0.5
Conclusion:
Since T< t 0.05,11 =2.20 and P-value > 0.05 hence we fail to reject the null hypothesis and conclude that there is insufficient evidence to support the claim that mean differs from 240 at 0.05 level of significance.
T-table used for calculation as
Add Answer to:
Many consumers pay careful atention to contents on packaged foods when making purchases, so stated nutri- that a random sample of n 12 frozen dinners of a Suppe was selected and the calorie content o...
Many consumers pay careful attention to stated nutritional contents on packaged foods when making purchases. It...
 Many consumers pay careful attention to stated nutritional
contents on packaged foods when making purchases. It is therefore
important that the information on packages be accurate. A random
sample of n = 12 frozen dinners of a certain type was
selected from production during a particular period, and the
calorie content of each one was determined. (This determination
entails destroying the product, so a census would certainly not be
desirable!) Here are the resulting observations, along with a
boxplot and...
Many consumers pay careful attention to stated nutritional
contents on packaged foods when making purchases. It is therefore
important that the information on packages be accurate. A random
sample of n = 12 frozen dinners of a certain type was
selected from production during a particular period, and the
calorie content of each one was determined. (This determination
entails destroying the product, so a census would certainly not be
desirable!) Here are the resulting observations, along with a
boxplot and...
Hypothesis Testing9.Many consumers pay careful attention to stated nutritional contents on packaged foods when making purchases,...
Hypothesis Testing9.Many consumers pay careful attention to stated nutritional contents on packaged foods when making purchases, so it is important that the information on packages is accurate. A random sample of n = 12 frozen dinners of a certain type was selected and the calorie content of each one was determined. The stated mean caloric content is 240. Conduct a hypothesis test to determine if the mean caloric content is different than 240. Use a 1% level of significance.Calorie Content255,...
along with completing the following areas, don't forget to label the critical value and test statistic...
 along with completing the following areas, don't forget to label
the critical value and test statistic on the curve provided, also
shade the rejection regions
Hypothesis Testing 9. Many consumers pay careful attention to stated nutritional contents on packaged foods when making purchases, so it is important that the information on packages is accurate. A random sample of n = 12 frozen dinners of a certain type was selected and the calorie content of each one was determined. The stated...
along with completing the following areas, don't forget to label
the critical value and test statistic on the curve provided, also
shade the rejection regions
Hypothesis Testing 9. Many consumers pay careful attention to stated nutritional contents on packaged foods when making purchases, so it is important that the information on packages is accurate. A random sample of n = 12 frozen dinners of a certain type was selected and the calorie content of each one was determined. The stated...
 Many consumers pay careful attention to stated nutritional
contents on packaged foods when making purchases. It is therefore
important that the information on packages be accurate. A random
sample of n = 12 frozen dinners of a certain type was
selected from production during a particular period, and the
calorie content of each one was determined. (This determination
entails destroying the product, so a census would certainly not be
desirable!) Here are the resulting observations, along with a
boxplot and...
Many consumers pay careful attention to stated nutritional
contents on packaged foods when making purchases. It is therefore
important that the information on packages be accurate. A random
sample of n = 12 frozen dinners of a certain type was
selected from production during a particular period, and the
calorie content of each one was determined. (This determination
entails destroying the product, so a census would certainly not be
desirable!) Here are the resulting observations, along with a
boxplot and...
 along with completing the following areas, don't forget to label
the critical value and test statistic on the curve provided, also
shade the rejection regions
Hypothesis Testing 9. Many consumers pay careful attention to stated nutritional contents on packaged foods when making purchases, so it is important that the information on packages is accurate. A random sample of n = 12 frozen dinners of a certain type was selected and the calorie content of each one was determined. The stated...
along with completing the following areas, don't forget to label
the critical value and test statistic on the curve provided, also
shade the rejection regions
Hypothesis Testing 9. Many consumers pay careful attention to stated nutritional contents on packaged foods when making purchases, so it is important that the information on packages is accurate. A random sample of n = 12 frozen dinners of a certain type was selected and the calorie content of each one was determined. The stated...
Most questions answered within 3 hours.
-
Using C++, build a sorter that can rank a sequence of numbers in
a descending order....
asked 7 minutes ago -
Part 1. Primitive Types, Sorting, Recursion for
Homework.java
a) Implement the static method initializeArray that receives...
asked 11 minutes ago -
Derive ground state term symbols. Use notation 2S(1/2) for state
2S1/2
a) d5
b) f3
c)...
asked 31 minutes ago -
A sample of size 31 will be drawn from a population with mean 39
and standard...
asked 1 hour ago -
What is the effect on the P-value when a test is changed from a
two-tailed hypothesis...
asked 1 hour ago -
I wish to estimate µ, the mean of a population. After I collect
and an-
alyze...
asked 1 hour ago -
At a local university, you poll a group of 115 students and find
that 37 of...
asked 1 hour ago -
Gladstone company tracks the number of units purchased and sold
throughout each accounting period but applies...
asked 1 hour ago -
When determining if a molecule's configuration is E or Z, what
determines the higher priority groups?
asked 1 hour ago -
13. What is the amount
of conversion cost transferred to finished goods? (Round
your intermediate calculations...
asked 1 hour ago -
Sulfuric Acid is a "strong" acid, but only releases a single
proton when it dissolves. What...
asked 1 hour ago -
The
second floor of a house is 6 m above the street level. How much
work...
asked 1 hour ago