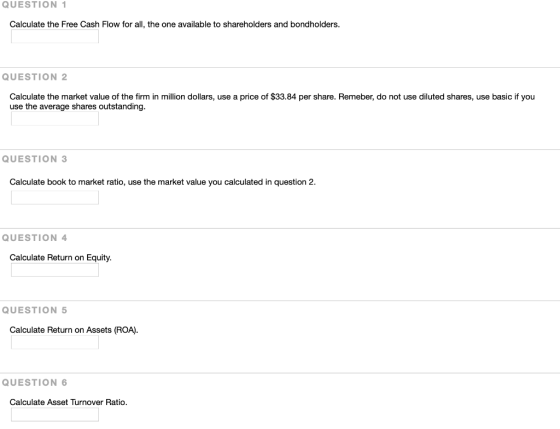
QUESTION Calculate the Free Cash Flow for all, the one available to shareholders and bondholders. QUESTION 2 Calculate the market value of the firm in million dollars, use a price of $33.84 per share. Remeber, do not use diluted shares, use basic if you use the average shares outstanding. QUESTION 3 Calculate book to market ratio, use the market value you calculated in question 2 QUESTION 4 Calculate Return on Equity QUESTION Calculate Return on Assets (ROA) QUESTION Calculate Asset Turnover Ratio.
Homework Answers
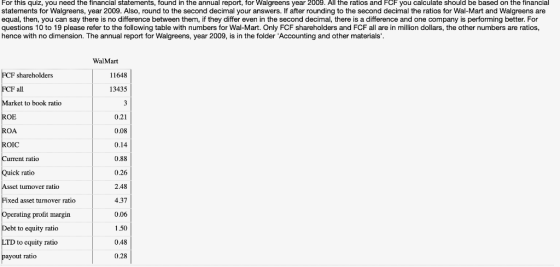
I have used Walgreens 2009 financing statement for the year ending 31 August 2009. All the below numbers are for FY19 (ending Aug-19)
1) Free cash flow for all :
FCF to all = Cash flow from operating + Cash flow from investing activities
= 3,744 - 1,274
FCF to all = $2,470 millions
2) Market capitalization at $33.84 share price
Average number of shares outstanding at of 31 August 2019 = 990 million
Market cap = 990 * 33.84
Market cap as of 31 August 2019= $33.5 billion
3) Book to market value ratio = Market cap / Book value of equity
= 33.5 / 14.4
Book to market value ratio = 2.33
4) Return on Equity = Net income / Book value of equity
= 2,006 / 14,376
Return on Equity = 13.95%
5) Return on Assets = Net income / Average total assets = Net income / (total assets in 2009 + total assets in 2008)/2
= 2,006 / (25,142+ 22,410) /2
Return on Assets = 8.44%
6) Asset turnover ratio = Sales in 2009 / Average assets
= 63,335 / (25,142+ 22,410) /2
Asset turnover ratio = 2.66 times
Add Answer to:
For this quiz, you need the financial statements, found in the annual report, for Walgreens year 2009. All the ratios a...
Using the financial statements for the Snider Corporation, calculate the 13 basic ratios found in the...
Using the financial statements for the Snider Corporation, calculate the 13 basic ratios found in the chapter. MARNI CORPORATION Balance Sheet December 31, 2018 Assets Current assets: Cash $50,000 Accounts receivable 100,000 Inventory 200,000 Total current assets $350,000 Net plant and equipment $650,000 Total assets $1,000,000 Liabilities and Stockholders' Equity Current liabilities: Accounts payable $100,000 Accrued expenses 90,000 Total current liabilities $190,000 Long-term liabilities: Long-term debt: 250,000 Total liabilities $440,000 Stockholders' equity: Common stock 100,000 Capital paid in excess of...
Using the financial statements for the Snider Corporation, calculate the 13 basic ratios found in the...
Using the financial statements for the Snider Corporation, calculate the 13 basic ratios found in the chapter. SNIDER CORPORATION Balance Sheet December 31, 20X1 Assets Current assets: Cash $ 57,100 Marketable securities 26,100 Accounts receivable (net) 184,000 Inventory 242,000 Total current assets $ 509,200 Investments 64,500 Plant and equipment. $689,000 Less: Accumulated depreciation 256,000 Net plant and equipment 433,000 Total assets $ 1,006,700 Liabilities and Stockholders' Equity Current liabilities: Accounts payable $ 92,700 Notes payable 76,500 Accrued taxes 17,000 Total...
Ch 04: Assignment - Analysis of Financial Statements 5. Profitability ratios Profitability ratios help in the...
 Ch 04: Assignment - Analysis of Financial Statements 5. Profitability ratios Profitability ratios help in the analysis of the combined impact of liquidity ratios, asset management ratios, and debt management ratios on the operating performance of a firm. Your boss has asked you to calculate the profitability ratios of Sixty-Second Avenue Inc. and make comments on its second-year performance as compared with its first-year performance. The following shows Sixty-Second Avenue Inc.'s income statement for the last two years. The company...
Suppose selected financial data of Target and Wal-Mart for 2020 are presented here (in millions). Net...
 Suppose selected financial data of Target and Wal-Mart for 2020 are presented here (in millions). Net sales Cost of goods sold Selling and administrative expenses Interest expense Other income (expense) Income tax expense Target Wal-Mart Corporation Stores, Inc. Income Statement Data for Year $65,357 $408,214 45,583 304,657 15,101 79,607 707 2,065 (94) (411) 1,384 7,139 $ 2.488 $ 14,335 Net income Current assets Noncurrent assets Total assets Current liabilities Balance Sheet Data (End of Year) $18.424 $48.331 26.109 122.375 $44,533...
all of 14.5A please and thank you. P14.5A (LO 3) Writing Suppose selected financial data of...
 all
of 14.5A please and thank you.
P14.5A (LO 3) Writing Suppose selected financial data of Target and Wal-Mart for 2020 are presented here (in millions). Compute selected ratios, and compare liquidity, profitability, and solvency for two companies. Net sales Cost of goods sold Selling and administrative expenses Interest expense Other income (expense) Income tax expense Net income Target Wal-Mart Corporation Stores, Inc. Income Statement Data for Year $65,357 $408,214 45,583 304,657 15,101 79,607 707 2,065 (94) (411) 1,384 7,139...
all
of 14.5A please and thank you.
P14.5A (LO 3) Writing Suppose selected financial data of Target and Wal-Mart for 2020 are presented here (in millions). Compute selected ratios, and compare liquidity, profitability, and solvency for two companies. Net sales Cost of goods sold Selling and administrative expenses Interest expense Other income (expense) Income tax expense Net income Target Wal-Mart Corporation Stores, Inc. Income Statement Data for Year $65,357 $408,214 45,583 304,657 15,101 79,607 707 2,065 (94) (411) 1,384 7,139...
Selected financial data of Target Corporation and Wal-Mart Stores, Inc. for a recent year are presented...
Selected financial data of Target Corporation and Wal-Mart Stores, Inc. for a recent year are presented here (in millions). Target Corporation Wal-Mart Stores, Inc. Income Statement Data for Year Net sales $61,471 $374,526 Cost of goods sold 41,895 286,515 Selling and administrative expenses 16,200 70,847 Interest expense 647 1,798 Other income (expense) 1,896 4,273 Income tax expense 1,776 6,908 Net income $ 2,849 $ 12,731 Balance Sheet Data (End of Year) Current assets $18,906 $ 47,585 Noncurrent assets 25,654 115,929...
Problem 18-05A a Suppose selected financial data of Target and Wal-Mart for 2020 are presented here...
 Problem 18-05A a Suppose selected financial data of Target and Wal-Mart for 2020 are presented here (in millions). Net sales Cost of goods sold Selling and administrative expenses Interest expense Other income (expense) Income tax expense Target Wal-Mart Corporation Stores, Inc. Income Statement Data for Year $65,357 $408,214 45,583 304,657 15,101 79,607 707 2,065 (94) (411) 1,384 7,139 $ 2,488 $ 14,335 Net income Current assets Noncurrent assets Total assets Current liabilities Balance Sheet Data (End of Year) $18,424 $48,331...
The following financial statements apply to Karl Company: Calculate the following ratios for 2018 and 2019....
 The following financial statements apply to Karl Company:
Calculate the following ratios for 2018 and 2019. Since 2017
numbers are not presented, do not use averages when calculating the
ratios for 2018. Instead, use the number presented on the 2018
balance sheet.
2019 2018 $420,000 16,000 436,000 $350,000 10,000 360,000 252,000 42,000 22,000 6,000 42,000 364,000 $ 72,000 206,000 38,000 20,000 6,000 36,000 306,000 $ 54,000 Revenues Net sales Other revenues Total revenues Expenses Cost of goods sold Selling expenses...
The following financial statements apply to Karl Company:
Calculate the following ratios for 2018 and 2019. Since 2017
numbers are not presented, do not use averages when calculating the
ratios for 2018. Instead, use the number presented on the 2018
balance sheet.
2019 2018 $420,000 16,000 436,000 $350,000 10,000 360,000 252,000 42,000 22,000 6,000 42,000 364,000 $ 72,000 206,000 38,000 20,000 6,000 36,000 306,000 $ 54,000 Revenues Net sales Other revenues Total revenues Expenses Cost of goods sold Selling expenses...
Problem 13-5A Suppose selected financial data of Target and Wal-Mart for 2017 are presented here (in...
 Problem 13-5A Suppose selected financial data of Target and Wal-Mart for 2017 are presented here (in millions). Wal-Mart Target Income Statement Data for Net sales Cost of goods sold Selling and administrative expenses Interest expense Other income (expense) Income tax expense Net income $66,900 45,000 15,000 $419,000 309,000 80,000 1,900 (80) 1,500 (390) 6,700 4,620 21,010 Balance Sheet Data (End of Year) Current assets Noncurrent assets Total assets Current liabilities Long-term debt Total stockholders" equity Total liabilities and stockholders $17,000...
only need 5-12 Suppose selected financial data of Target and Wal-Mart for 2020 are presented here...
 only need 5-12
Suppose selected financial data of Target and Wal-Mart for 2020 are presented here millions). Net sales Cost of goods sold Selling and administrative expenses Interest expense Other income (expense) Income tax expense Target Wal-Mart Corporation Stores, Inc. Income Statement Data for Year $65,357 $408,214 45,583 304,657 15,101 79,607 707 2,065 (94) (411) 1,384 7,139 $ 2,488 $ 14,335 Net income Current assets Noncurrent assets Total assets Balance Sheet Data (End of Year) $18,424 $48,331 26,109 122,375 $44,533...
only need 5-12
Suppose selected financial data of Target and Wal-Mart for 2020 are presented here millions). Net sales Cost of goods sold Selling and administrative expenses Interest expense Other income (expense) Income tax expense Target Wal-Mart Corporation Stores, Inc. Income Statement Data for Year $65,357 $408,214 45,583 304,657 15,101 79,607 707 2,065 (94) (411) 1,384 7,139 $ 2,488 $ 14,335 Net income Current assets Noncurrent assets Total assets Balance Sheet Data (End of Year) $18,424 $48,331 26,109 122,375 $44,533...
 Ch 04: Assignment - Analysis of Financial Statements 5. Profitability ratios Profitability ratios help in the analysis of the combined impact of liquidity ratios, asset management ratios, and debt management ratios on the operating performance of a firm. Your boss has asked you to calculate the profitability ratios of Sixty-Second Avenue Inc. and make comments on its second-year performance as compared with its first-year performance. The following shows Sixty-Second Avenue Inc.'s income statement for the last two years. The company...
 Suppose selected financial data of Target and Wal-Mart for 2020 are presented here (in millions). Net sales Cost of goods sold Selling and administrative expenses Interest expense Other income (expense) Income tax expense Target Wal-Mart Corporation Stores, Inc. Income Statement Data for Year $65,357 $408,214 45,583 304,657 15,101 79,607 707 2,065 (94) (411) 1,384 7,139 $ 2.488 $ 14,335 Net income Current assets Noncurrent assets Total assets Current liabilities Balance Sheet Data (End of Year) $18.424 $48.331 26.109 122.375 $44,533...
 all
of 14.5A please and thank you.
P14.5A (LO 3) Writing Suppose selected financial data of Target and Wal-Mart for 2020 are presented here (in millions). Compute selected ratios, and compare liquidity, profitability, and solvency for two companies. Net sales Cost of goods sold Selling and administrative expenses Interest expense Other income (expense) Income tax expense Net income Target Wal-Mart Corporation Stores, Inc. Income Statement Data for Year $65,357 $408,214 45,583 304,657 15,101 79,607 707 2,065 (94) (411) 1,384 7,139...
all
of 14.5A please and thank you.
P14.5A (LO 3) Writing Suppose selected financial data of Target and Wal-Mart for 2020 are presented here (in millions). Compute selected ratios, and compare liquidity, profitability, and solvency for two companies. Net sales Cost of goods sold Selling and administrative expenses Interest expense Other income (expense) Income tax expense Net income Target Wal-Mart Corporation Stores, Inc. Income Statement Data for Year $65,357 $408,214 45,583 304,657 15,101 79,607 707 2,065 (94) (411) 1,384 7,139...
 Problem 18-05A a Suppose selected financial data of Target and Wal-Mart for 2020 are presented here (in millions). Net sales Cost of goods sold Selling and administrative expenses Interest expense Other income (expense) Income tax expense Target Wal-Mart Corporation Stores, Inc. Income Statement Data for Year $65,357 $408,214 45,583 304,657 15,101 79,607 707 2,065 (94) (411) 1,384 7,139 $ 2,488 $ 14,335 Net income Current assets Noncurrent assets Total assets Current liabilities Balance Sheet Data (End of Year) $18,424 $48,331...
 The following financial statements apply to Karl Company:
Calculate the following ratios for 2018 and 2019. Since 2017
numbers are not presented, do not use averages when calculating the
ratios for 2018. Instead, use the number presented on the 2018
balance sheet.
2019 2018 $420,000 16,000 436,000 $350,000 10,000 360,000 252,000 42,000 22,000 6,000 42,000 364,000 $ 72,000 206,000 38,000 20,000 6,000 36,000 306,000 $ 54,000 Revenues Net sales Other revenues Total revenues Expenses Cost of goods sold Selling expenses...
The following financial statements apply to Karl Company:
Calculate the following ratios for 2018 and 2019. Since 2017
numbers are not presented, do not use averages when calculating the
ratios for 2018. Instead, use the number presented on the 2018
balance sheet.
2019 2018 $420,000 16,000 436,000 $350,000 10,000 360,000 252,000 42,000 22,000 6,000 42,000 364,000 $ 72,000 206,000 38,000 20,000 6,000 36,000 306,000 $ 54,000 Revenues Net sales Other revenues Total revenues Expenses Cost of goods sold Selling expenses...
 Problem 13-5A Suppose selected financial data of Target and Wal-Mart for 2017 are presented here (in millions). Wal-Mart Target Income Statement Data for Net sales Cost of goods sold Selling and administrative expenses Interest expense Other income (expense) Income tax expense Net income $66,900 45,000 15,000 $419,000 309,000 80,000 1,900 (80) 1,500 (390) 6,700 4,620 21,010 Balance Sheet Data (End of Year) Current assets Noncurrent assets Total assets Current liabilities Long-term debt Total stockholders" equity Total liabilities and stockholders $17,000...
 only need 5-12
Suppose selected financial data of Target and Wal-Mart for 2020 are presented here millions). Net sales Cost of goods sold Selling and administrative expenses Interest expense Other income (expense) Income tax expense Target Wal-Mart Corporation Stores, Inc. Income Statement Data for Year $65,357 $408,214 45,583 304,657 15,101 79,607 707 2,065 (94) (411) 1,384 7,139 $ 2,488 $ 14,335 Net income Current assets Noncurrent assets Total assets Balance Sheet Data (End of Year) $18,424 $48,331 26,109 122,375 $44,533...
only need 5-12
Suppose selected financial data of Target and Wal-Mart for 2020 are presented here millions). Net sales Cost of goods sold Selling and administrative expenses Interest expense Other income (expense) Income tax expense Target Wal-Mart Corporation Stores, Inc. Income Statement Data for Year $65,357 $408,214 45,583 304,657 15,101 79,607 707 2,065 (94) (411) 1,384 7,139 $ 2,488 $ 14,335 Net income Current assets Noncurrent assets Total assets Balance Sheet Data (End of Year) $18,424 $48,331 26,109 122,375 $44,533...
Most questions answered within 3 hours.
-
Phosphorous + bromine = phosphorous tribromide. If 35.0 g of
bromine are reacted and 27.9 grams...
asked 1 hour ago -
Derive the long wavelength limit of the Planck energy density
distribution
asked 1 hour ago -
Calculate the pH of each of the following solutions.
0.50 M HBr
3.1×10⁻⁴ M KOH
4.2×10⁻⁵...
asked 4 hours ago -
For the year ended December 31, Depot Max’s cost of merchandise
sold was $85,600. Inventory at the...
asked 4 hours ago -
Week 10 - Professional Memo Assignment
Professional Memo Assignment
Your mission for this week, should you...
asked 4 hours ago -
Write a Python program that stores the data for each
player on the team, and it...
asked 5 hours ago -
In
the last 3 months, mike never knows when he is going to get his
allowance...
asked 5 hours ago -
Is Ca(OH)2 a Bronsted base, Lewis base, or both? Why?
asked 5 hours ago -
1A- Why don’t voters complain about U.S. tariffs on imported
sugar?
Because sugar is only a...
asked 5 hours ago -
Cash Payback Period
Primera Banco is evaluating two capital investment proposals for
a drive-up ATM kiosk,...
asked 5 hours ago -
Create a button in Swift (Xcode) that will create a charge,
create a charge using Stripe's...
asked 5 hours ago -
The reaction rate of CO and NO2 in the reaction
CO(g) + NO2(g) → CO2(g) +...
asked 5 hours ago