
Homework Answers

Add Answer to:
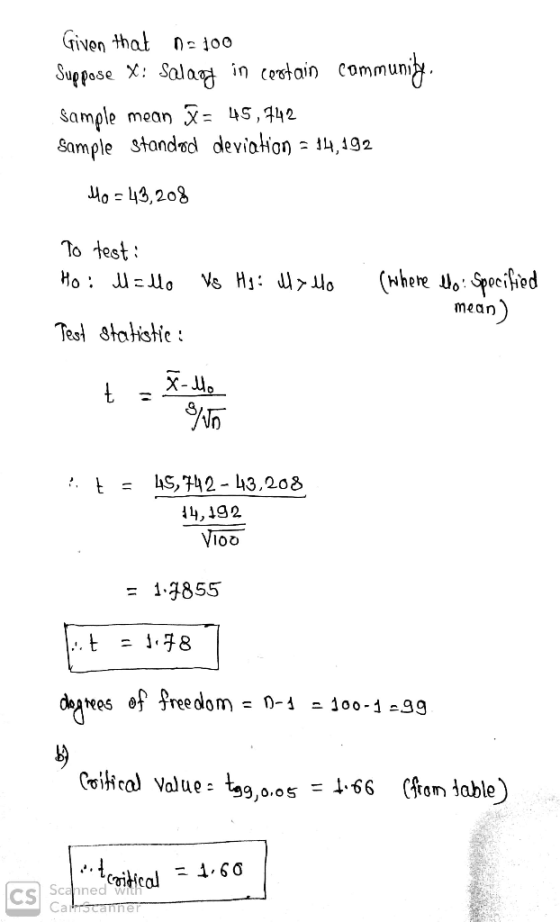
6. Ten years ago, the mean salary in a certain community was $43,208. An investor thinks it is now higher than that...
Nota Ten years ago, the average amount of time a family spent eating supper together was...
 Nota Ten years ago, the average amount of time a family spent eating supper together was 27.8 minutes. A sociolegist believes and finds the sample average to be 24.307 minutes. The sample data look about bell-shaped. She calculated a test statistic oft- this average hars decreased. She randomly selects a sample of 12 famitiles (a) what is the p-value 7 (b) 1r she conducts the test at significance level Q.0S, what should the condlusion be? (3 decimal places) Do not...
A sociologist is studying the age of the population in Blue Valley. Ten years ago, the...
A sociologist is studying the age of the population in Blue Valley. Ten years ago, the population was such that 20% were under 20 years old, 11% were in the 20- to 35-year-old bracket, 34% were between 36 and 50, 24% were between 51 and 65, and 11% were over 65. A study done this year used a random sample of 210 residents. This sample is given below. At the 0.01 level of significance, has the age distribution of the...
A sociologist is studying the age of the population in Blue Valley. Ten years ago, the population...
A sociologist is studying the age of the population in Blue Valley. Ten years ago, the population was such that 20% were under 20 years old, 14% were in the 20- to 35-year-old bracket, 32% were between 36 and 50, 24% were between 51 and 65, and 10% were over 65. A study done this year used a random sample of 210 residents. This sample is given below. At the 0.01 level of significance, has the age distribution of the...
A student at a four-year college claims that mean enrollment at four-year colleges is higher than...
 A student at a four-year college claims that mean enrollment at four-year colleges is higher than at two-year colleges in the United States. Two surveys are conducted. Of the 35 four-year colleges surveyed, the mean enrollment was 5,466 with a standard deviation of 8,191. Of the 35 two-year colleges surveyed, the mean enrollment was 5,068 with a standard deviation of 4,777. Test the student's claim at the 0.10 significance level. a) The null and alternative hypothesis would be: O Hopp...
Test the claim that the mean GPA of night students is larger than 3 at the...
Test the claim that the mean GPA of night students is larger than 3 at the .025 significance level. Based on a sample of 15 people, the sample mean GPA was 3.05 with a standard deviation of 0.02, find the following to 4 decimal places: t-statistic and p-value Do we reject the null hypothesis, or fail to reject the null hypothesis?
We want to estimate the mean starting salary in a population of graduates. Approximately normally distributed....
 We want to estimate the mean starting salary in a population of graduates. Approximately normally distributed. Standard deviation = 10 In a random sample of 31 graduates, the mean starting salary was 61.8 and the standard deviation was 12. 1. What is the lower (smaller) endpoint of the 90% confidence interval for the population mean? 2. What is the upper (larger) endpoint of the 90% confidence interval for the population mean? 3. If null hypothesis = 60 and alternate hypothesis...
Is there evidence that the mean annual salary of a Tesla owner is more than $225700?...
Is there evidence that the mean annual salary of a Tesla owner is more than $225700? Data was collected from 36 Tesla owners across the US. The mean annual salary of those 36 Tesla owners was $226000 with a standard deviation of $980. Answer this question, at the 1% significance level, by performing the following steps of a hypothesis test . a) Complete the null and alternative hypotheses by typing into the box as indicated. Ho : mu (Type one: <, =, >)...
The age distribution of the Canadian population and the age distribution of a random sample of 455 residents in the Indian community of a village are shown below. Age (years) Percent of Canadian Po...
The age distribution of the Canadian population and the age distribution of a random sample of 455 residents in the Indian community of a village are shown below. Age (years) Percent of Canadian Population Observed Number in the Village Under 5 7.2% 48 5 to 14 13.6% 79 15 to 64 67.1% 281 65 and older 12.1% 47 Use a 5% level of significance to test the claim that the age distribution of the general Canadian population fits the age...
Several years ago, the mean height of women 20 years of age or older was 63.7...
 Several years ago, the mean height of women 20 years of age or older was 63.7 inches. Suppose that a random sample of 45 women who are 20 years of age or older today results in a mean height of 63.9 inches. (a) State the appropriate null and alternative hypotheses to assess whether women are taller today (b) Suppose the P-value for this test is 0.12. Explain what this value represents. (C) Write a conclusion for this hypothesis test assuming...
For a random sample of 36 data pairs, the sample mean of the differences was 0.72....
 For a random sample of 36 data pairs, the sample mean of the differences was 0.72. The sample standard deviation of the differences was 2. At the 5% level of significance, test the claim that the population mean of the differences is different from 0. (a) Is it appropriate to use a Student's t distribution for the sample test statistic? Explain. No, the sample size is not larger than 30. Yes, the sample size is larger than 30. No, the...
 Nota Ten years ago, the average amount of time a family spent eating supper together was 27.8 minutes. A sociolegist believes and finds the sample average to be 24.307 minutes. The sample data look about bell-shaped. She calculated a test statistic oft- this average hars decreased. She randomly selects a sample of 12 famitiles (a) what is the p-value 7 (b) 1r she conducts the test at significance level Q.0S, what should the condlusion be? (3 decimal places) Do not...
 A student at a four-year college claims that mean enrollment at four-year colleges is higher than at two-year colleges in the United States. Two surveys are conducted. Of the 35 four-year colleges surveyed, the mean enrollment was 5,466 with a standard deviation of 8,191. Of the 35 two-year colleges surveyed, the mean enrollment was 5,068 with a standard deviation of 4,777. Test the student's claim at the 0.10 significance level. a) The null and alternative hypothesis would be: O Hopp...
 We want to estimate the mean starting salary in a population of graduates. Approximately normally distributed. Standard deviation = 10 In a random sample of 31 graduates, the mean starting salary was 61.8 and the standard deviation was 12. 1. What is the lower (smaller) endpoint of the 90% confidence interval for the population mean? 2. What is the upper (larger) endpoint of the 90% confidence interval for the population mean? 3. If null hypothesis = 60 and alternate hypothesis...
 Several years ago, the mean height of women 20 years of age or older was 63.7 inches. Suppose that a random sample of 45 women who are 20 years of age or older today results in a mean height of 63.9 inches. (a) State the appropriate null and alternative hypotheses to assess whether women are taller today (b) Suppose the P-value for this test is 0.12. Explain what this value represents. (C) Write a conclusion for this hypothesis test assuming...
 For a random sample of 36 data pairs, the sample mean of the differences was 0.72. The sample standard deviation of the differences was 2. At the 5% level of significance, test the claim that the population mean of the differences is different from 0. (a) Is it appropriate to use a Student's t distribution for the sample test statistic? Explain. No, the sample size is not larger than 30. Yes, the sample size is larger than 30. No, the...
Most questions answered within 3 hours.
-
What does a 2-sided p value of 0.04 mean? (I am not asking if it
is...
asked 4 minutes ago -
A parallel-plate capacitor is made from two aluminum-foil
sheets, each 7.8 cmcm wide and 5.1 mmlong....
asked 6 minutes ago -
1. why is toluene a stronger nucleophile than benzene?
2.why is phenol a stronger nucleophile than...
asked 23 minutes ago -
4. How can you solve for the density of the liquid from the
slope? Please show...
asked 23 minutes ago -
when 2053 j of heat is added to 46.3 g of hexane C6H14 the
temperature increases...
asked 46 minutes ago -
I need new and unique answers, please. (Use your own words,
don't copy and paste), Please...
asked 49 minutes ago -
MCL 445.111 et seq. deals with Home Solicitation Sales.
MCL stands for Michigan Compiled Laws which...
asked 40 minutes ago -
Which of the following items may not create an NOL?
a.
sole proprietorship loss
b.
personal...
asked 45 minutes ago -
A hypothetical solution forms between a solid and a liquid. The
values of the thermodynamic quantities...
asked 43 minutes ago -
a)An ideal heat pump is being considered for use in heating an
environment with a temperature...
asked 46 minutes ago -
.
Convert the following pairs of voltage and current waveforms to
phasor form. Each pair of...
asked 48 minutes ago -
A 6.5 cm diameter ball has a terminal speed of 22 m/s. What is
the ball's...
asked 1 hour ago