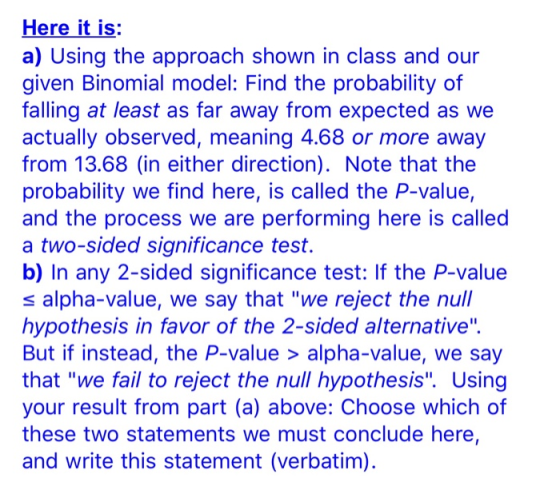
Here it is: a) Using the approach shown in class and our given Binomial model: Find the probability of falling at least as far away from expected as we actually observed, meaning 4.68 or more away from 13.68 (in either direction). Note that the probability we find here, is called the P-value, and the process we are performing here is called a two-sided significance test. b) In any 2-sided significance test: If the P-value s alpha-value, we say that "we reject the null hypothesis in favor of the 2-sided alternative". But if instead, the P-value > alpha-value, we say that "we fail to reject the null hypothesis". Using your result from part (a) above: Choose which of these two statements we must conclude here, and write this statement (verbatim)
Homework Answers
-
Null hypothesis: The null hypothesis is that the percentage of adult residents are Hispanic is 19%i.e.

Alternative hypothesis: The alternative hypothesis is that the percentage of the adult residents is Hispanic is less than 19% i.e.

The conditions are given by,
The sample is a simple random sample. And the sample is less than 10% of all the adult residents are Hispanic.
The Success / Failure conditions are given by,
 and
and .
. -
Now, we can proceed further to do the test is given by,
We have n = 72, X =9 and a hypothesized p = 0.19.


And the


The z-score is given by,


= -1.41
-
The P – Value is given by,


Conclusion: Because of the P – Value is high, we do not reject the null hypothesis
 or we may fail to reject the null hypothesis with the
sample data given. And hence we may conclude that there is not
sufficient evidence that the proportion of the adult residents who
are Hispanic is less than all the adult residents who are Hispanic.
Yes, this is apparent underrepresentaion of Hispanics call into
question the fairness of the jury selection system.
or we may fail to reject the null hypothesis with the
sample data given. And hence we may conclude that there is not
sufficient evidence that the proportion of the adult residents who
are Hispanic is less than all the adult residents who are Hispanic.
Yes, this is apparent underrepresentaion of Hispanics call into
question the fairness of the jury selection system.


 and
and .
.


 or we may fail to reject the null hypothesis with the
sample data given. And hence we may conclude that there is not
sufficient evidence that the proportion of the adult residents who
are Hispanic is less than all the adult residents who are Hispanic.
Yes, this is apparent underrepresentaion of Hispanics call into
question the fairness of the jury selection system.
or we may fail to reject the null hypothesis with the
sample data given. And hence we may conclude that there is not
sufficient evidence that the proportion of the adult residents who
are Hispanic is less than all the adult residents who are Hispanic.
Yes, this is apparent underrepresentaion of Hispanics call into
question the fairness of the jury selection system.Add Answer to:
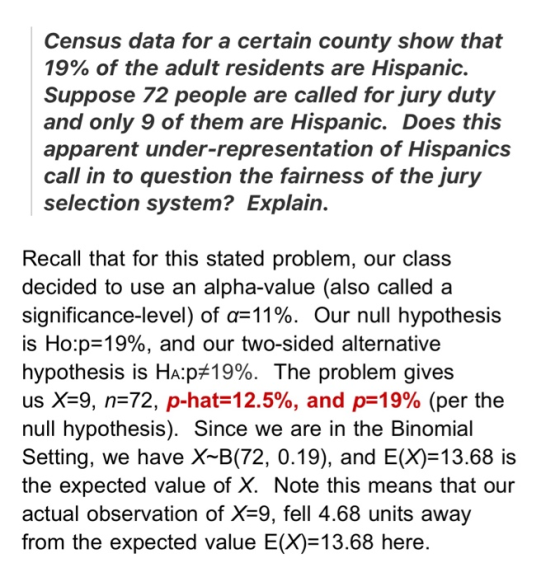
census data doe a certain county show that 19% of the adult residents are hispanic. suppose 72 people are called for ju...
18. 1. Major health studies try very hard to select a sample that is representative of...
18. 1. Major health studies try very hard to select a sample that is representative of the various ethnic groups making up the U.S. population. Here is the breakdown, by ethnicity, of subjects enrolled in a major study of sleep apnea: White Hispanic African American Asian/Pacific Native American Total 4821 277 510 88 598 6294 The known ethnic distribution in the United States, according to census data, is as follows: White Hispanic African American Asian/Pacific Native American Total 0.756 0.091...
Please show all work and explain here is the data and explanation of 12.4 here is appendix D
 please show all work and explain
here is the data and explanation of 12.4
here is appendix D
12.12. * In Problem 12.4, find the value of x2. If the dice really are true, what is the probability of getting a value of X2this large or larger? Explain whether the evidence suggests the dice are loaded. (See Appendix D for the necessary probabili- ties.) 12.4.I throw three dice together a total of 400 times, record the number of sixes in...
please show all work and explain
here is the data and explanation of 12.4
here is appendix D
12.12. * In Problem 12.4, find the value of x2. If the dice really are true, what is the probability of getting a value of X2this large or larger? Explain whether the evidence suggests the dice are loaded. (See Appendix D for the necessary probabili- ties.) 12.4.I throw three dice together a total of 400 times, record the number of sixes in...
Most questions answered within 3 hours.
-
Angel Corporation has $10,000,000 of
8.0% 25 year bonds dated May 1, 2018 with interest payable...
asked 25 minutes ago -
7.
________ involves individuals trading goods they already have or
providing services in exchange for something...
asked 30 minutes ago -
Share your research problem. What databases did you search as
you gathered evidence to support your...
asked 30 minutes ago -
what process occurs to form microspores and megaspores in flowering
plants?
asked 37 minutes ago -
C++
I need to use the function getData to put in all my data using
arrays....
asked 36 minutes ago -
A block is hung by a string from the inside roof of a van. When
the...
asked 43 minutes ago -
Do you think companies should not go for long term debt in their
capital structure to...
asked 52 minutes ago -
I create an address book where the user enters the name, phone
and email in the...
asked 58 minutes ago -
The production capacity for acrylonitrile
(C3H3N) in the United States exceeds 2
million pounds per year....
asked 1 hour ago -
explain and comment out your answer
43. How many address lines are required to address a...
asked 1 hour ago -
A sample of 45 observations is selected from a normal
population. The sample mean is 49,...
asked 1 hour ago -
A construction company is planning to bid on a building
contract. The bid costs the company...
asked 1 hour ago