
Homework Answers

Add Answer to:
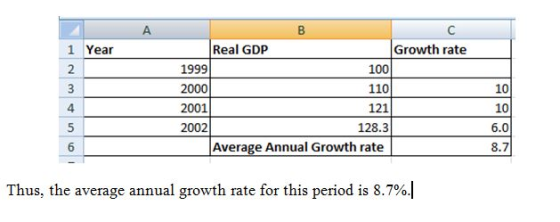
The following table gives real GDP figures for an economy for four years. Fill in the growth rate for each yea...
Using the following data, calculate the annual growth rate of real GDP per person for China...
Using the following data, calculate the annual growth rate of real GDP per person for China for the years in the table. Year Real GDP per Capita (in 1996 U.S. dollars) 2000 4,001 2001 4,389 2002 4,847 2003 5,321 2004 5,771 Calculate the annual growth rate of real GDP per person for China for the given years. Round your answer to the nearest tenth of a percent. Growth rate, 2001: % Growth rate, 2002: % Growth rate, 2003: % Growth...
1. Economic fluctuations and growth Real GDP (Billions of dollars) 376 380 388 408 404 Year 2000 2001 2004 2005 2006 2007 2008 400 412 The grey line on the following graph shows the economy...
 1. Economic fluctuations and growth Real GDP (Billions of dollars) 376 380 388 408 404 Year 2000 2001 2004 2005 2006 2007 2008 400 412 The grey line on the following graph shows the economy's long-term growth trend Use the blue points (circle symbol) to plot the real GDP in each of the years listed. Be sure to plot from ieft to right. Line segments will automatically connect the points. Next, place the green triangle on the graph to indicate...
4) Calculating Real GDP Growth: Using the years 2017 and 2018 compute the real GDP growth...
 4) Calculating Real GDP Growth: Using the years 2017 and 2018 compute the real GDP growth rate for the year 2018 using the real GDP calculated above, (GDP ). YY1 Growth Year Nominal GDP GDP chain index (2012 = 100) Population 2007 1461 billion 2008 15145593 hillon 2009 5 14,620 billion 2010S15940 billion 2011 15.796.5 Billion 2012 Bilion 2013 STONI NI 2014 IS19 Non 2015 S 150 on 2016 S hillon 2017190 billion 2017 in From De Feeve Bank of...
The following table gives some figures from forecasts of real GDP in 2005 dollars) and population completed in mid-2014
The following table gives some figures from forecasts of real GDP in 2005 dollars) and population completed in mid-2014. Real GDP 2018 $18, 121.00 billionReal GDP 2019 $18,664.63 billionPopulation 2018 329.00 millionPopulation 2019 332.29 million The real GDP growth rate between 2018 and 2019 will be (3.00) %. (Round your response to two decimal places.) The population growth rate between 2018 and 2019 will be (1) %. (Round your response to two decimal places.) Per capita GDP in 2018 is projected to be $ ....
please help me Measuring the Macroeconomy a. Real vs. Nominal GDP FILL IN THE BLANKS. Year...
 please help me
Measuring the Macroeconomy a. Real vs. Nominal GDP FILL IN THE BLANKS. Year Real GDP GDP Deflator Economic Growth Rate (Billions) (Billions) 2000 $54,000 $57,500 $60,000 2001 00 2002 $63,750 103 b. Given the following information, calculate (1) the unemployment rate (2) the employment rate and (3) the labor force participation rate. Total Population = 2,000,000 Children, Military & Institutionalized = 500,000 Retirees, Stay-at-home parents, students = 325,000 Unemployed = 58,500 Calculate the Civilian Non-institutionalized Population (CNP):...
please help me
Measuring the Macroeconomy a. Real vs. Nominal GDP FILL IN THE BLANKS. Year Real GDP GDP Deflator Economic Growth Rate (Billions) (Billions) 2000 $54,000 $57,500 $60,000 2001 00 2002 $63,750 103 b. Given the following information, calculate (1) the unemployment rate (2) the employment rate and (3) the labor force participation rate. Total Population = 2,000,000 Children, Military & Institutionalized = 500,000 Retirees, Stay-at-home parents, students = 325,000 Unemployed = 58,500 Calculate the Civilian Non-institutionalized Population (CNP):...
Instructions: Enter your responses rounded to the nearest billion. a. Calculate real GDP for 2016 using...
 Instructions: Enter your
responses rounded to the nearest billion.
a. Calculate real GDP for 2016 using 2000 prices.
$ billion
b. By how much did real GDP increase between 2000 and 2016?
$ billion
c. By how much did nominal GDP increase between 2000 and
2016?
$ billion
Refer to the data below (all values are in billions): Year Nominal GDP GDP Deflator (in Billions of Dollars) (Price Index 2009 100) 2000 2001 2002 2003 2004 2005 2006 2007 2008 2009...
Instructions: Enter your
responses rounded to the nearest billion.
a. Calculate real GDP for 2016 using 2000 prices.
$ billion
b. By how much did real GDP increase between 2000 and 2016?
$ billion
c. By how much did nominal GDP increase between 2000 and
2016?
$ billion
Refer to the data below (all values are in billions): Year Nominal GDP GDP Deflator (in Billions of Dollars) (Price Index 2009 100) 2000 2001 2002 2003 2004 2005 2006 2007 2008 2009...
Please let me know if I solved anything incorrectly, and what’s the right way to do...
 Please let me know if I solved anything incorrectly, and
what’s the right way to do it
The following table shows data on a hypothetical country's real GDP from 2000 through 2008: Aggregate Output (Billions of Dollars) 186 190 192 202 200 194 196 200 202 Year 2000 2001 2002 2003 2004 2005 2006 2007 2008 The green line on the following graph shows the economy's long-term growth trend. Use the blue points (circle symbol) to plot the real GDP...
Please let me know if I solved anything incorrectly, and
what’s the right way to do it
The following table shows data on a hypothetical country's real GDP from 2000 through 2008: Aggregate Output (Billions of Dollars) 186 190 192 202 200 194 196 200 202 Year 2000 2001 2002 2003 2004 2005 2006 2007 2008 The green line on the following graph shows the economy's long-term growth trend. Use the blue points (circle symbol) to plot the real GDP...
Suppose that a company's annual sales were $1,200,000 in 1999. The annual growth rate of sales from 1999 to 2000 was 16 percent, from 2000 to 2001 it was −5 percent, and from 2001 to 2002 it was 2...
Suppose that a company's annual sales were $1,200,000 in 1999. The annual growth rate of sales from 1999 to 2000 was 16 percent, from 2000 to 2001 it was −5 percent, and from 2001 to 2002 it was 22 percent. The geometric mean growth rate of sales over this three-year period is calculated as 10.37 percent. Use the geometric mean growth rate and determine the forecasted sales for 2004.
7. Study the table below and identify the following: a. years in which the economy expanded...
 7. Study the table below and identify the following: a. years in which the economy expanded b. years in which the economy contracted c. peaks d. troughs Year 1998 Annual Percentage Change in Real GDP (2007 $) -3.1 2.6 5.7 5.2 2.8 4.6 Year 1982 1983 1984 1985 1986 1987 1988 1989 1990 1991 1992 1993 1994 1995 1996 1997 Annual Percentage Change in Real GDP (2007 $) 4.1 5.4 5.4 1.4 2.7 2.0 3.1 3.2 2.4 2.2 1.1 -2.9...
2. Budget balances and the national debt The following table lists federal outlays, revenues, and GDP...
 2. Budget balances and the national debt The following table lists federal outlays, revenues, and GDP for the U.S. economy during several years. Revenues (Billions of dollars) 2,025 Outlays (Billions of dollars) GDP (Billions of dollars) Year 2000 1,789 9,817 2001 1,991 10,128 1,853 10,470 2002 2003 1,863 2,011 2,160 2,293 1,783 10,961 2004 1,880 11,686 Plot the data for revenues and outlays as a percentage of GDP on the following graph, rounded to the nearest percent. Use the purple...
 1. Economic fluctuations and growth Real GDP (Billions of dollars) 376 380 388 408 404 Year 2000 2001 2004 2005 2006 2007 2008 400 412 The grey line on the following graph shows the economy's long-term growth trend Use the blue points (circle symbol) to plot the real GDP in each of the years listed. Be sure to plot from ieft to right. Line segments will automatically connect the points. Next, place the green triangle on the graph to indicate...
 4) Calculating Real GDP Growth: Using the years 2017 and 2018 compute the real GDP growth rate for the year 2018 using the real GDP calculated above, (GDP ). YY1 Growth Year Nominal GDP GDP chain index (2012 = 100) Population 2007 1461 billion 2008 15145593 hillon 2009 5 14,620 billion 2010S15940 billion 2011 15.796.5 Billion 2012 Bilion 2013 STONI NI 2014 IS19 Non 2015 S 150 on 2016 S hillon 2017190 billion 2017 in From De Feeve Bank of...
 please help me
Measuring the Macroeconomy a. Real vs. Nominal GDP FILL IN THE BLANKS. Year Real GDP GDP Deflator Economic Growth Rate (Billions) (Billions) 2000 $54,000 $57,500 $60,000 2001 00 2002 $63,750 103 b. Given the following information, calculate (1) the unemployment rate (2) the employment rate and (3) the labor force participation rate. Total Population = 2,000,000 Children, Military & Institutionalized = 500,000 Retirees, Stay-at-home parents, students = 325,000 Unemployed = 58,500 Calculate the Civilian Non-institutionalized Population (CNP):...
please help me
Measuring the Macroeconomy a. Real vs. Nominal GDP FILL IN THE BLANKS. Year Real GDP GDP Deflator Economic Growth Rate (Billions) (Billions) 2000 $54,000 $57,500 $60,000 2001 00 2002 $63,750 103 b. Given the following information, calculate (1) the unemployment rate (2) the employment rate and (3) the labor force participation rate. Total Population = 2,000,000 Children, Military & Institutionalized = 500,000 Retirees, Stay-at-home parents, students = 325,000 Unemployed = 58,500 Calculate the Civilian Non-institutionalized Population (CNP):...
 Instructions: Enter your
responses rounded to the nearest billion.
a. Calculate real GDP for 2016 using 2000 prices.
$ billion
b. By how much did real GDP increase between 2000 and 2016?
$ billion
c. By how much did nominal GDP increase between 2000 and
2016?
$ billion
Refer to the data below (all values are in billions): Year Nominal GDP GDP Deflator (in Billions of Dollars) (Price Index 2009 100) 2000 2001 2002 2003 2004 2005 2006 2007 2008 2009...
Instructions: Enter your
responses rounded to the nearest billion.
a. Calculate real GDP for 2016 using 2000 prices.
$ billion
b. By how much did real GDP increase between 2000 and 2016?
$ billion
c. By how much did nominal GDP increase between 2000 and
2016?
$ billion
Refer to the data below (all values are in billions): Year Nominal GDP GDP Deflator (in Billions of Dollars) (Price Index 2009 100) 2000 2001 2002 2003 2004 2005 2006 2007 2008 2009...
 Please let me know if I solved anything incorrectly, and
what’s the right way to do it
The following table shows data on a hypothetical country's real GDP from 2000 through 2008: Aggregate Output (Billions of Dollars) 186 190 192 202 200 194 196 200 202 Year 2000 2001 2002 2003 2004 2005 2006 2007 2008 The green line on the following graph shows the economy's long-term growth trend. Use the blue points (circle symbol) to plot the real GDP...
Please let me know if I solved anything incorrectly, and
what’s the right way to do it
The following table shows data on a hypothetical country's real GDP from 2000 through 2008: Aggregate Output (Billions of Dollars) 186 190 192 202 200 194 196 200 202 Year 2000 2001 2002 2003 2004 2005 2006 2007 2008 The green line on the following graph shows the economy's long-term growth trend. Use the blue points (circle symbol) to plot the real GDP...
 7. Study the table below and identify the following: a. years in which the economy expanded b. years in which the economy contracted c. peaks d. troughs Year 1998 Annual Percentage Change in Real GDP (2007 $) -3.1 2.6 5.7 5.2 2.8 4.6 Year 1982 1983 1984 1985 1986 1987 1988 1989 1990 1991 1992 1993 1994 1995 1996 1997 Annual Percentage Change in Real GDP (2007 $) 4.1 5.4 5.4 1.4 2.7 2.0 3.1 3.2 2.4 2.2 1.1 -2.9...
 2. Budget balances and the national debt The following table lists federal outlays, revenues, and GDP for the U.S. economy during several years. Revenues (Billions of dollars) 2,025 Outlays (Billions of dollars) GDP (Billions of dollars) Year 2000 1,789 9,817 2001 1,991 10,128 1,853 10,470 2002 2003 1,863 2,011 2,160 2,293 1,783 10,961 2004 1,880 11,686 Plot the data for revenues and outlays as a percentage of GDP on the following graph, rounded to the nearest percent. Use the purple...
Most questions answered within 3 hours.
-
Consider two empty containers A and B whose volumes are
10mL and 20mL respectively. 1mL of...
asked 24 minutes ago -
QUESTION 6
Determine the linear momentum of a 2,800 kg houseboat going 3
m/s.
9,100 kg.m/s...
asked 38 minutes ago -
Jor-el throws a ball upward from the top of a 728 foot building
on the planet...
asked 43 minutes ago -
Which of the following will most likely to happen if Federal
Reserve Bank decreases the money...
asked 25 minutes ago -
You’ve just joined the investment banking firm of Dewey,
Cheatum, and Howe. They’ve offered you two...
asked 19 minutes ago -
An air conditioner cools 226 m^3/min of humid air at 36 oC and
98% relative humidity...
asked 18 minutes ago -
Given P(Ec ) = 0.43, P(F) = 0.52, and P(EF) = 0.18.
Find P( E |...
asked 21 minutes ago -
Vaughn Manufacturing acquires a coal mine at a cost of $1870000.
Intangible development costs total $354000....
asked 28 minutes ago -
Question 5
What effect would a decrease in
temperature have on pressure, assuming that volume
(T)...
asked 40 minutes ago -
Draw the Lewis dot structures for the following molecules. None
of the atoms have a formal...
asked 45 minutes ago -
What does it mean when an element is radioactive?
a.
It means the element is changing...
asked 45 minutes ago -
A company deposits $6,000 in a bank at the end of every year for
10 years....
asked 45 minutes ago