
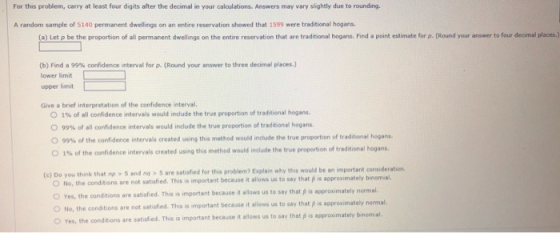


For this problem, carry at least four digits after the decimal in your calculations. Answers may vary slightly due to rounding. A random sample of 5140 permanent dwellings on an entire reservation showed that 1599 were traditional hogans. (a) Let p be the proportion of all permanent dwellings on the entire reservation that are traditional hogans. Find a point estimate for p. (Round your answer to four decimal places.) (b) Find a 99% confidence interval for p. (Round your answer to three decimal places.) lower limit upper limit Give a brief interpretation of the confidence interval 0 1% of all confidence intervals would include the true proportion of traditional hogans. O 99% of all confidence intervals would include the true proportion of traditional hogans. O 99% of the confidence intervals created us ng this method would include the true proportion of traditional hogan. 1% of the confidence intervals created using this method would include the true proportion of traditional hogan. you think that np >5 and nq5 are satisfied for this problem? Explain why this would be an important consideration O No, the condtions are not satisfied. This is important because it allows us to say that p is approximately binomial. is approximately normal. allows us to say that are satisfied. This is important because ONo, the condtions are not satisfied. This is important because it allows us to say thatp because it allows us to say that p is approximately binomial. O Yes, the conditions are satisfied. This is important
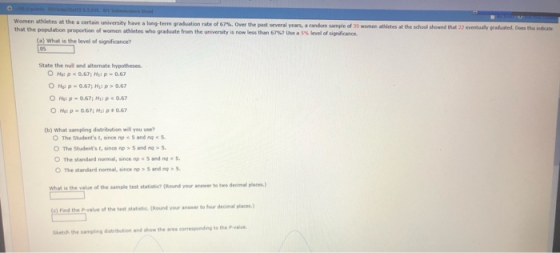
es at the a crtan university have a long-term graduation rate ef 67%. Over the past several yeas, aandam that the population proportion of women athletes who graduate from the university is now less than 67%, Use a 5% level of sgnfance. sample of y9 women athletes at the scheel showed that 22 eventul, Ordusted. Dom a) What is the level of significance? 05 State the null and alternate hypotheses O Hai p 0.67, Hs p-0.67 O HE p-0.67; Hu p 5 and nqs O The standard normal, since np 5 and nq> s. decimal plases) What is the value of the sample test statistic? (Round your anawer to Find the Pvalue of the test statistic (Round your anwer to four decimal plces) Sketch the sampling datribution and show the area conresponding to the
o-3-2-1 0 1 2 3 0-3-2-1 o- 2 2 3 0-3 2112 3 (d) Based on your answers in parts (a) to (c), will you reject or fail to reject the null hypothesis? Are the data statistically significant at level a? O At the α-0.05 level, we reject the null hypothess and conclude the data are statistically significant. O At the α-0.05 level, we reject the null hypothess and conclude the data are not statistically significant. O At the α-0.05 level, we fail to reject the null hypothesa and conclude the data are statstically significant. O At the α-0.05 level, we fail to reject the null hypothesa and conclude the data are not statstically sanificant.
(d) Based on your answers in parts (o) to (o), will you reject or fai to reject the null hypotheais? Are the dota statistically significant at level O At the a - o.05 level, we reject the null hypothesis and conclade the data are statisticaly sionificant At the α-0.0s ievel, we reject the null hypothesis and conclude tho data are not statistically Signacent O At the α-OOS level, we fai, to reject the null hypothesis and conclude the data are statistica"y significan' O At the α-0.05 level, wo fail to reject the null hypothesis and condude the data are not statistically significant. (e) Interpret your conclusion in the context of the application O There is sufficient evidence at the 0.05 level to conclude that the true proporton of women athletes who graduate is less than o.67. 。There is insufficient evidence at the 0.05 level to conclude that the true proportion of women athletes who graduate is less than 0.67. Wewing Saved Work Reven to Lest Reaponse
Suppose the heights of 18-year-old men are approximately normally distributed, with mean 70 inches and standard deviation 4 inches a) What is the probability that an 18-year-old man selected at random is between 69 and 71 iches tan (Round your answer to four deo al pla。 (b) If a random sample of twelve 18-year-old men is selected, what is the probability that the mean height is between 69 and 71 inches? (Round your answer to four decimal places (c) Compare your answers to parts (a) and (b). Is the probability in part (b) much higher? Why would you expect this? The probability in part (b)s much higher because the mean is smaller for the-distribution. O The probability in part (b) is much higher because the mean is larger for the x distribution O The probability in part (b) is much higher because the standard deviation is larger for the x distribution O The probability in part (b) is much higher because the standard deviation is smaller for the x distribution. O The probability in part (b) is much lower because the standard deviation is smaller for the x distribution
Suppose the heights of 18-year-old men are approximately normally distributed, with mean 70 inches and standard deviation 4 inches. o) what is the probability that an 18-year-old man selected at random is between 69 and 71 inches tall? (Round your answer to four decimal places.) If a random sample of twelve 18-year-old men s selected, what is the probability that the mean height x s between 69 and 71 . ches? Round your ans to four deo nal places. (c) Compare your answers to parts (a) and (b). Is the probability in part (b) much higher? Why would you expect this? O The probability in part (b) is much higher because the mean is smaller for the x distribution 0 The probability in part (b) is much higher because the mean is larger for the-distribut O The probability in part (b) is much higher because the standard deviation is larger for the x distribution. O The probability in part (b) is much higher because the standard devistion is smaller for the x distribution O The probability in part (b) is much lower because the standard deviation is smaller for the distribution Submit Answer View Previous Question Queston 9 of 17 Viewet Questo
Homework Answers


Add Answer to:
The method of tree ring dating gave the following years A.D for an archaeological excavation site. Assume tha...
The method of tree-ring dating gave the following years A.D. for an archaeological excavation site. Assume...
The method of tree-ring dating gave the following years A.D. for an archaeological excavation site. Assume that the population of x values has an approximately normal distribution. 1,250 1,292 1,250 1,194 1,268 1,316 1,275 1,317 1,275 (a) Use a calculator with mean and standard deviation keys to find the sample mean year x and sample standard deviation s. (Round your answers to the nearest whole number.) x= _______ A.D. s= _______ yr (b) Find a 90% confidence interval for the...
The method of tree-ring dating gave the following years A.D. for an archaeological excavation site. Assume...
The method of tree-ring dating gave the following years A.D. for an archaeological excavation site. Assume that the population of x values has an approximately normal distribution. 1,285 1,194 1,299 1,180 1,268 1,316 1,275 1,317 1,275 (a) Use a calculator with mean and standard deviation keys to find the sample mean year x and sample standard deviation s. (Round your answers to the nearest whole number.) x = 1268 Correct: Y our answer is correct. A.D. s = 43 Incorrect:...
The method of tree ring dating gave the following years A.D. for an archaeological excavation site....
The method of tree ring dating gave the following years A.D. for an archaeological excavation site. Assume that the population of x values has an approximately normal distribution. 1250 1271 1285 1320 1268 1316 1275 1317 1275 (a) Use a calculator with mean and standard deviation keys to find the sample mean year x and sample standard deviation s. (Round your answers to the nearest whole number.) x = A.D. s = yr (b) Find a 90% confidence interval for...
The method of tree ring dating gave the following years A.D. for an archaeological excavation site....
The method of tree ring dating gave the following years A.D. for an archaeological excavation site. Assume that the population of x values has an approximately normal distribution. 1201 1229 1264 1257 1268 1316 1275 1317 1275 (a) Use a calculator with mean and standard deviation keys to find the sample mean year x and sample standard deviation s. (Round your answers to the nearest whole number.) x = A.D. s = yr (b) Find a 90% confidence interval for...
The method of tree ring dating gave the following years A.D. for an archaeological excavation site....
 The method of tree ring dating gave the following years A.D. for an archaeological excavation site. Assume that the population of x values has an approximately normal distribution. 1264 1229 1194 1243 1268 1316 1275 1317 1275 (a) Use a calculator with mean and standard deviation keys to find the sample mean year x and sample standard deviation s. (Round your answers to the nearest whole number.) A.D yr (b) Find a 90% confidence interval for the mean of all...
The method of tree ring dating gave the following years A.D. for an archaeological excavation site....
The method of tree ring dating gave the following years A.D. for an archaeological excavation site. Assume that the population of x values has an approximately normal distribution. 1243 1208 1320 1201 1268 1316 1275 1317 1275 (a) Use a calculator with mean and standard deviation keys to find the sample mean year x and sample standard deviation s. (Round your answers to the nearest whole number.) x = A.D. s = yr (b) Find a 90% confidence interval for...
The method of tree ring dating gave the following years A.D. for an archaeological excavation site....
The method of tree ring dating gave the following years A.D. for an archaeological excavation site. Assume that the population of x values has an approximately normal distribution. 1187 1229 1320 1257 1268 1316 1275 1317 1275 (a) Use a calculator with mean and standard deviation keys to find the sample mean year x and sample standard deviation s. (Round your answers to the nearest whole number.) x = A.D. s = yr (b) Find a 90% confidence interval for...
The method of tree ring dating gave the following years A.D. for an archaeological excavation site....
The method of tree ring dating gave the following years A.D. for an archaeological excavation site. Assume that the population of x values has an approximately normal distribution. 1292 1180 1208 1236 1268 1316 1275 1317 1275 (a) Use a calculator with mean and standard deviation keys to find the sample mean year x and sample standard deviation s. (Round your answers to the nearest whole number.) x = A.D. s = yr (b) Find a 90% confidence interval for...
The method of tree ring dating gave the following years A.D. for an archaeological excavation site....
The method of tree ring dating gave the following years A.D. for an archaeological excavation site. Assume that the population of x values has an approximately normal distribution. 1194 1222 1285 1285 1268 1316 1275 1317 1275 (a) Use a calculator with mean and standard deviation keys to find the sample mean year x and sample standard deviation s. (Round your answers to the nearest whole number.) x = A.D. s = yr (b) Find a 90% confidence interval for...
The method of tree ring dating gave the following years A.D. for an archaeological excavation site....
The method of tree ring dating gave the following years A.D. for an archaeological excavation site. Assume that the population of x values has an approximately normal distribution. 1292 1264 1229 1243 1268 1316 1275 1317 1275 (a) Use a calculator with mean and standard deviation keys to find the sample mean year x and sample standard deviation s. (Round your answers to the nearest whole number.) x = A.D. s = yr (b) Find a 90% confidence interval for...
 The method of tree ring dating gave the following years A.D. for an archaeological excavation site. Assume that the population of x values has an approximately normal distribution. 1264 1229 1194 1243 1268 1316 1275 1317 1275 (a) Use a calculator with mean and standard deviation keys to find the sample mean year x and sample standard deviation s. (Round your answers to the nearest whole number.) A.D yr (b) Find a 90% confidence interval for the mean of all...
Most questions answered within 3 hours.
-
Following maintenance and calibration, an extrusion machine
produces aluminum tubing with a mean outside diameter of...
asked 6 minutes ago -
In ionic equations,should every polyatomic ions be considered as
such or can this be further broken...
asked 9 minutes ago -
A first-time investor has found the following percentages of
stocks that are available: 30% are low...
asked 22 minutes ago -
Clean Corporation manufactures liquid window cleaner. The
following information concerns its work in process:
•
Beginning...
asked 20 minutes ago -
The following data were obtained in order to determine the
density of a cylindrical metal bar....
asked 24 minutes ago -
1. When ONE molecule of glucose is totally oxidized to
CO2 and H2O, how many net...
asked 26 minutes ago -
The probability that person A will pass Finite Mathematics is 7
8 and the probability that...
asked 41 minutes ago -
A mortgage of $200,000 is amortized over 25 years using level
payments at the end of...
asked 50 minutes ago -
Physics: Need help with inclined planes.
- Say an object is moving down an inclined plane...
asked 47 minutes ago -
Describe the process of nitrogen excretion in the body. List 4
steps and explain each step
asked 1 hour ago -
Determine the inductance of a solenoid with 670 turns in a
length of 29 cm ....
asked 1 hour ago -
Summarize the ways through which sales and operations
planning can be integrated. Then, extend your findings...
asked 1 hour ago