Key Objective: Crusty Pizza Executives must forecast December sales for the 10 stores in worksheet “Time Series”. Use d...
Key Objective: Crusty Pizza Executives must forecast December sales for the 10 stores in worksheet “Time Series”.
- Use data in worksheet “Time Series”. Plot the data for each store.
- Develop a sales forecast for each of the 10 stores for the month of December, using:
- A three month moving average
- A 2- month weighted moving average, with weights of 0.7 on the most recent month and 0.3 on the older month.
- Exponential smoothing with an alpha value of 0.25. Assume February forecast is January’s actual.
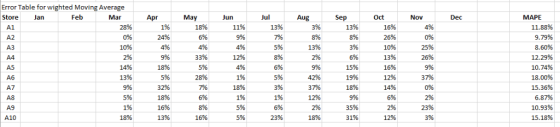
- Compute measures of forecast accuracy to recommend the best forecasting technique to use for the data.
- Rank the 10 stores based on the forecasts you made with the technique that you determined (in the above step) to be the best forecasting method.
| Monthly Profit Data for ten stores | ||||||||||||
| Store | Jan | Feb | Mar | Apr | May | Jun | Jul | Aug | Sep | Oct | Nov | Dec |
| A1 | $26,811.50 | $27,322.19 | $21,193.85 | $22,725.94 | $27,066.85 | $28,854.28 | $25,024.06 | $27,066.85 | $23,491.98 | $29,109.63 | $26,300.80 | ? |
| A2 | $973.59 | $1,021.09 | $1,009.21 | $1,329.79 | $1,163.56 | $1,116.07 | $1,211.06 | $1,282.29 | $1,377.28 | $1,068.58 | $1,163.56 | ? |
| A3 | $10,424.42 | $8,687.02 | $8,380.42 | $8,176.02 | $8,584.82 | $8,789.22 | $8,278.22 | $9,709.02 | $8,993.62 | $8,380.42 | $11,344.22 | ? |
| A4 | $28,513.55 | $27,513.08 | $28,263.44 | $25,762.25 | $20,009.51 | $24,761.77 | $21,510.23 | $22,010.46 | $23,261.06 | $20,259.63 | $28,513.55 | ? |
| A5 | $27,107.93 | $21,234.54 | $26,656.13 | $21,234.54 | $24,171.24 | $22,364.04 | $21,686.34 | $24,171.24 | $20,330.95 | $18,523.75 | $21,008.64 | ? |
| A6 | $16,897.72 | $19,009.93 | $16,321.66 | $16,321.66 | $22,658.30 | $20,546.09 | $22,274.26 | $15,361.56 | $21,506.18 | $22,466.28 | $16,129.64 | ? |
| A7 | $15,456.55 | $20,964.06 | $21,141.72 | $15,989.54 | $16,344.86 | $19,720.43 | $19,365.10 | $14,212.92 | $19,187.44 | $20,608.73 | $20,253.41 | ? |
| A8 | $11,021.75 | $8,502.49 | $9,762.12 | $11,441.62 | $10,286.96 | $10,496.90 | $10,286.96 | $11,756.53 | $12,491.31 | $11,546.59 | $12,071.44 | ? |
| A9 | $10,338.61 | $10,232.03 | $10,338.61 | $12,257.11 | $12,683.45 | $11,937.36 | $11,511.03 | $11,937.36 | $8,739.86 | $9,485.94 | $12,043.95 | ? |
| A10 | $6,643.92 | $5,979.53 | $7,507.63 | $6,245.28 | $7,839.83 | $7,042.56 | $5,913.09 | $5,315.14 | $7,906.26 | $6,378.16 | $7,042.56 | ? |
Homework Answers


Add Answer to:
Key Objective: Crusty Pizza Executives must forecast December sales for the 10 stores in worksheet “Time Series”. Use d...
Key Objective: Crusty Pizza Executives must forecast December sales for the 10 stores in worksheet “Time...
Key Objective: Crusty Pizza Executives must forecast December sales for the 10 stores in worksheet “Time Series”. Use data in worksheet “Time Series”. Plot the data for each store. Develop a sales forecast for each of the 10 stores for the month of December, using: A three month moving average A 2- month weighted moving average, with weights of 0.7 on the most recent month and 0.3 on the older month. Exponential smoothing with an alpha value of 0.25. Assume...
Problem II The following time series shows the sales of a clothing store over a 10-week...
 Problem II The following time series shows the sales of a clothing store over a 10-week period. Week Sales ($1,000s) 15 a. Compute a 4-week moving average for the above time series. b. Compute the mean square error (MSE) and mean Absolut deviation (MAD) for the 4. week moving average forecast. c. Use a -0.3 to compute the exponential smoothing values and MSE and MAD for the time series. d. Forecast sales for week 11. e. Which model is the...
Masters Level work....all work must be shown. FORECASTING Forecasting ASSIgnment 1. Given the following data, use...
 Masters Level work....all work must be shown. FORECASTING
Forecasting ASSIgnment 1. Given the following data, use a three-quarter moving average to forecast the demand for the third quarter of this year. Note, the first quarter is January, February, and March; the second quarter is April, May, and June; the third quarter is July, August, September, and the 4° quarter is October, November, and December ul ct 50 This year 235 245 255 295 305 295 Answer (Please show your work...
Masters Level work....all work must be shown. FORECASTING
Forecasting ASSIgnment 1. Given the following data, use a three-quarter moving average to forecast the demand for the third quarter of this year. Note, the first quarter is January, February, and March; the second quarter is April, May, and June; the third quarter is July, August, September, and the 4° quarter is October, November, and December ul ct 50 This year 235 245 255 295 305 295 Answer (Please show your work...
1. Exercise 5.1 The forecasting staff for the Prizer Corporation has developed a model to predict...
 1. Exercise 5.1 The forecasting staff for the Prizer Corporation has developed a model to predict sales of its air-cushioned-ride snowmobiles. The model specifies that sales, S, vary jointly with disposable personal income, Y, and the population between ages 15 and 40,Z, and inversely with the price of the snowmobiles, P. Based on past data, the best estimate of this relationship is: where k has been estimated (from past data) to equal 100 If Y $13,000, Z- $1,200, and P...
Accountancy
First Thing: Save This File as Your Whole NameAfter nearly destroying the city of Springfield USA because of many near nuclear melt downs caused by Homer Simpson, Mr. Burns decided to go into selling cookies. On January 2, 2020, Mr. Burn continued his Good Old Fashion Cookies Empire. The company is still a merchandise company and still uses a perpetual inventory system.1. Prepare all the journal entries on a document. (To be turned in separately)2. Post all journal entries to...
summatize the following info and break them into differeng key points. write them in yojr own...
 summatize the following info and break them into differeng key points. write them in yojr own words
apartus
6.1 Introduction—The design of a successful hot box appa- ratus is influenced by many factors. Before beginning the design of an apparatus meeting this standard, the designer shall review the discussion on the limitations and accuracy, Section 13, discussions of the energy flows in a hot box, Annex A2, the metering box wall loss flow, Annex A3, and flanking loss, Annex...
summatize the following info and break them into differeng key points. write them in yojr own words
apartus
6.1 Introduction—The design of a successful hot box appa- ratus is influenced by many factors. Before beginning the design of an apparatus meeting this standard, the designer shall review the discussion on the limitations and accuracy, Section 13, discussions of the energy flows in a hot box, Annex A2, the metering box wall loss flow, Annex A3, and flanking loss, Annex...
 Problem II The following time series shows the sales of a clothing store over a 10-week period. Week Sales ($1,000s) 15 a. Compute a 4-week moving average for the above time series. b. Compute the mean square error (MSE) and mean Absolut deviation (MAD) for the 4. week moving average forecast. c. Use a -0.3 to compute the exponential smoothing values and MSE and MAD for the time series. d. Forecast sales for week 11. e. Which model is the...
 Masters Level work....all work must be shown. FORECASTING
Forecasting ASSIgnment 1. Given the following data, use a three-quarter moving average to forecast the demand for the third quarter of this year. Note, the first quarter is January, February, and March; the second quarter is April, May, and June; the third quarter is July, August, September, and the 4° quarter is October, November, and December ul ct 50 This year 235 245 255 295 305 295 Answer (Please show your work...
Masters Level work....all work must be shown. FORECASTING
Forecasting ASSIgnment 1. Given the following data, use a three-quarter moving average to forecast the demand for the third quarter of this year. Note, the first quarter is January, February, and March; the second quarter is April, May, and June; the third quarter is July, August, September, and the 4° quarter is October, November, and December ul ct 50 This year 235 245 255 295 305 295 Answer (Please show your work...
 1. Exercise 5.1 The forecasting staff for the Prizer Corporation has developed a model to predict sales of its air-cushioned-ride snowmobiles. The model specifies that sales, S, vary jointly with disposable personal income, Y, and the population between ages 15 and 40,Z, and inversely with the price of the snowmobiles, P. Based on past data, the best estimate of this relationship is: where k has been estimated (from past data) to equal 100 If Y $13,000, Z- $1,200, and P...
 summatize the following info and break them into differeng key points. write them in yojr own words
apartus
6.1 Introduction—The design of a successful hot box appa- ratus is influenced by many factors. Before beginning the design of an apparatus meeting this standard, the designer shall review the discussion on the limitations and accuracy, Section 13, discussions of the energy flows in a hot box, Annex A2, the metering box wall loss flow, Annex A3, and flanking loss, Annex...
summatize the following info and break them into differeng key points. write them in yojr own words
apartus
6.1 Introduction—The design of a successful hot box appa- ratus is influenced by many factors. Before beginning the design of an apparatus meeting this standard, the designer shall review the discussion on the limitations and accuracy, Section 13, discussions of the energy flows in a hot box, Annex A2, the metering box wall loss flow, Annex A3, and flanking loss, Annex...
Most questions answered within 3 hours.
-
Kylie is a single mom with two dependent children,
Tanner, age 7 and Olivia, age 11....
asked 40 minutes ago -
Phosphorous + bromine = phosphorous tribromide. If 35.0 g of
bromine are reacted and 27.9 grams...
asked 2 hours ago -
Derive the long wavelength limit of the Planck energy density
distribution
asked 1 hour ago -
Calculate the pH of each of the following solutions.
0.50 M HBr
3.1×10⁻⁴ M KOH
4.2×10⁻⁵...
asked 5 hours ago -
For the year ended December 31, Depot Max’s cost of merchandise
sold was $85,600. Inventory at the...
asked 5 hours ago -
Week 10 - Professional Memo Assignment
Professional Memo Assignment
Your mission for this week, should you...
asked 5 hours ago -
Write a Python program that stores the data for each
player on the team, and it...
asked 5 hours ago -
In
the last 3 months, mike never knows when he is going to get his
allowance...
asked 6 hours ago -
Is Ca(OH)2 a Bronsted base, Lewis base, or both? Why?
asked 6 hours ago -
1A- Why don’t voters complain about U.S. tariffs on imported
sugar?
Because sugar is only a...
asked 6 hours ago -
Cash Payback Period
Primera Banco is evaluating two capital investment proposals for
a drive-up ATM kiosk,...
asked 6 hours ago -
Create a button in Swift (Xcode) that will create a charge,
create a charge using Stripe's...
asked 6 hours ago